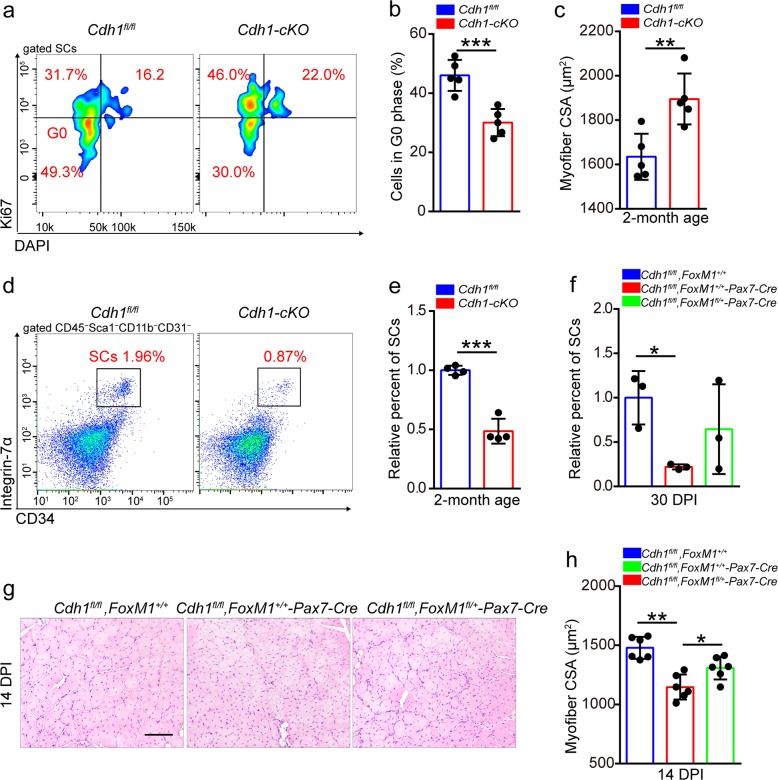
Fig. 7. Loss of Cdh1 results in the loss of SC pool.
a The mononuclear cells were isolated from the skeletal muscles of mice (2 months of age) and were stained with cell surface markers, DAPI and Ki67. The quiescent percentage of SCs was analyzed by flow cytometry. b Quantification of the percentage of G0 phase in SCs of mice (2 months of age) (n = 5). c Average CSA of TA in Cdh1fl/fl and Cdh1-cKO mice (2 months of age) (n = 5). d The mononuclear cells were isolated from skeletal muscles of mice (2 months of age), and were stained with SC markers. The population of SCs was analyzed by flow cytometry. e Quantification of the relative percentage of SCs per total mononuclear cells isolated from the skeletal muscles of mice at 2 months of age (n = 4). f Quantification of the relative percentage of SCs per total mononuclear cells isolated from the skeletal muscles of mice (2 months of age) at 30 DPI (n = 3). g Mice were induced with serial muscle injuries by BaCl2 injection. HE staining of the TA muscle cross-sections of mice (2 months of age) at 14 DPI of the second injury. Scale bar, 100 μm. h Average CSA of TA muscles of mice (2 months of age) at 14 DPI of the second injury (n = 6). Error bars represent the means ± SD. *p < 0.05, **p < 0.01, ***p < 0.001; Student’s t test or one-way ANOVA.

