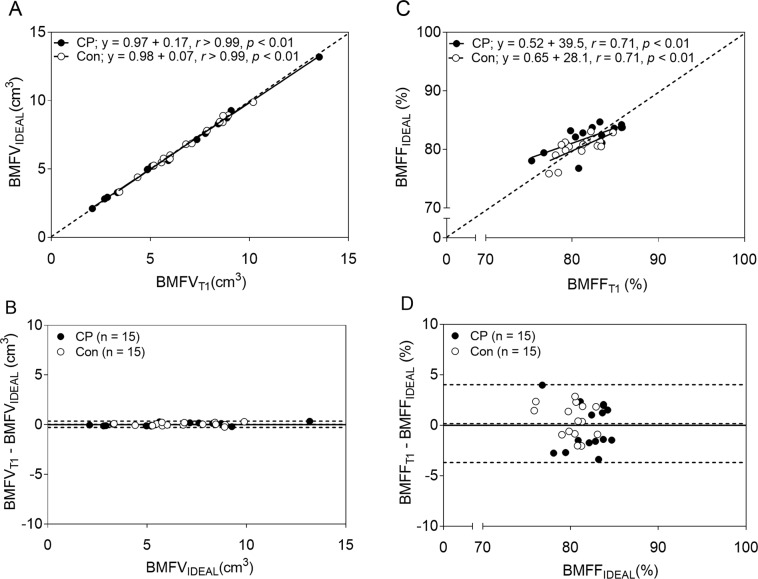
Figure 3.
Comparison of bone marrow fat estimated by the procedure using standard T1-weighted magnetic resonance images and the procedure using fat and water images generated from the IDEAL technique. (A) The scatter plot shows strong agreement between bone marrow fat volume estimated from the standard T1-weighted images (BMFVT1) and bone marrow fat volume estimated using fat and water images from the IDEAL technique (BMFVIDEAL). (B) The Bland-Altman plot shows the level of agreement between BMFVT1 and BMFVIDEAL. (C) The scatter plot shows moderate agreement between bone marrow fat fraction estimated from the standard T1-weighted magnetic images (BMFFT1) and bone marrow fat volume estimated using fat and water images (BMFFIDEAL). (D) The Bland-Altman plot shows the level of agreement between BMFFT1 and BMFFIDEAL. The dotted lines in panels A and C represent the lines of identity. The dotted lines in panels B and D indicate the mean difference ± 2 SD between estimates from the standard T1-weighted and the fat and water images. The solid lines indicate no difference for estimation between the two methods.

