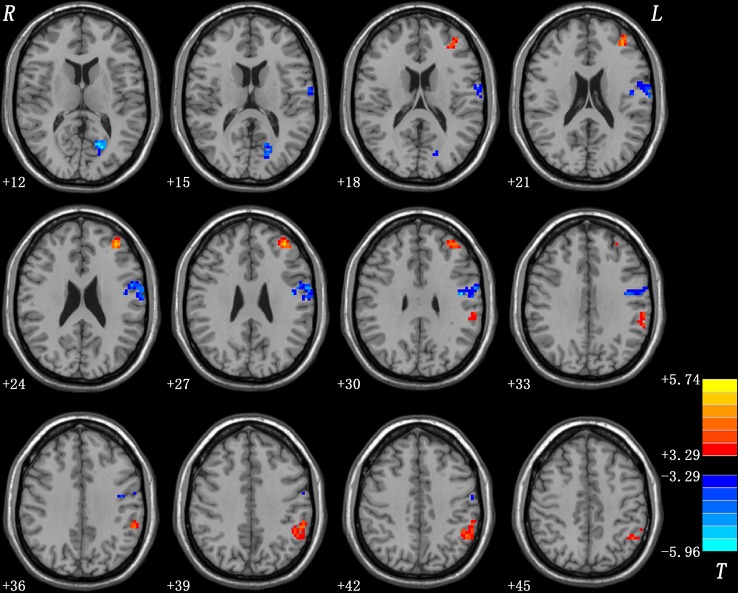
Figure 1.
Brain regions with abnormal GFC in patients with OCD. The threshold was set at p < 0.05 corrected by the GRF method. Red and blue denote increased and decreased GFC values respectively. Colour bar indicates t values from two-sample t-tests. L, left side; R, right side; GFC, global-brain functional connectivity; OCD, obsessive-compulsive disorder; GRF, Gaussian Random Field.

