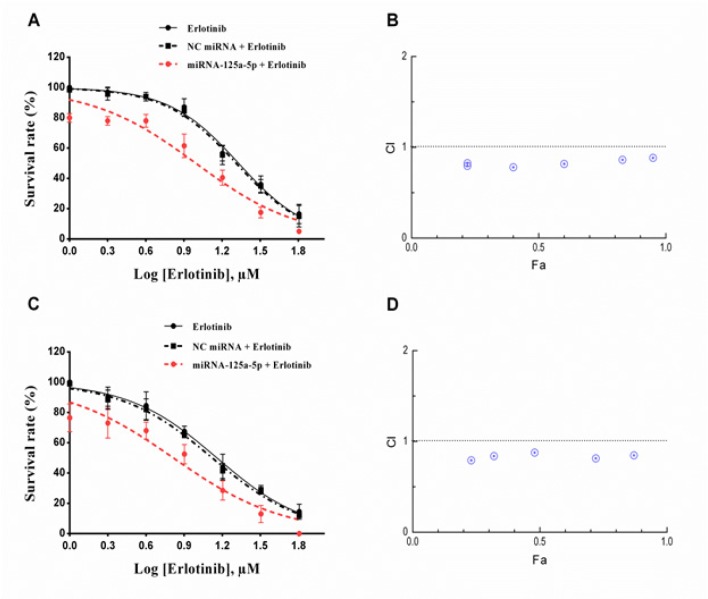
Figure 2.
Effect of miRNA-125a-5p in Combination with Erlotinib on Cell Survival. Human A549 cells were treated with miRNA-125a-5p (50 nM) and different concentrations of erlotinib for 24 h (A and B) and 48 h (C and D). Cell survival was determined by the MTT assay as described in the method section. Dose-response curves were plotted using GraphPad Prism 6.01 software. Bars represent mean±SD (n=3). Data from three independent experiments were used to calculate the combination index (CI) according the method of Chou-Talalay. A horizontal dashed marks CI=1

