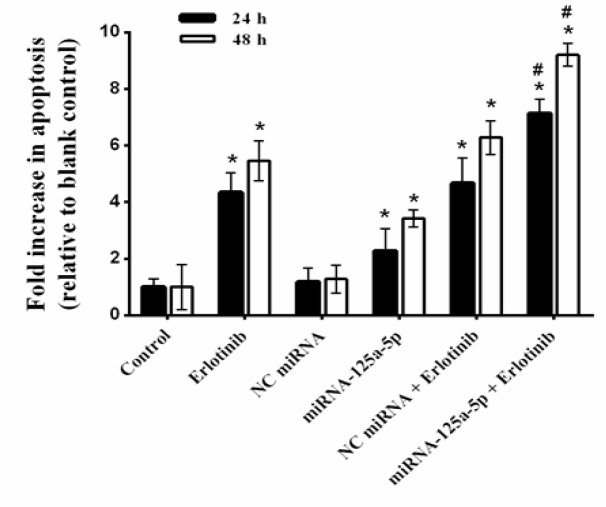
Figure 4.
Cell Apoptosis of A549 Cells Treated with miRNA-125a-5p and Erlotinib. The cells were treated with miRNA-125a-5p (50 nM), negative control (NC) miRNA (50 nM) and erlotinib (IC50 doses of 24 and 48 h), alone and in combination, and then apoptosis was measured by cell death ELISA. The data are expressed as mean±SD (n=3); *p<0.05 versus blank control or NC miRNA; #p<0.05 versus miRNA-125a-5p or erlotinib

