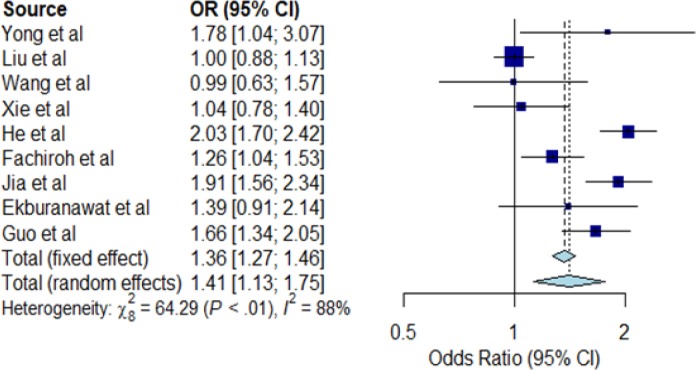
Figure 2.
Forest Plot for Salted Fish Consumption and NPC Risk. The Individual horizontal line as seen on the forest plot is representing a single study with the blue box portraying the result plotted while the line shows the 95% confidence interval of the displayed result. The bigger the box, the larger the size of the study. The diamond shape at the lowermost part of the plot demonstrates the average of the combined result (1.41) of all the individual studies whereas the 95% confidence intervals (1.13; 1.75) is represented by the horizontal points of the diamond. The horizontal points of the diamond did not cross the vertical line, therefore our study detected statistically significant differences between the studies. I2 statistic provided an idea on heterogeneity (88%) of the studies, therefore showing inconsistency of the studies. Note that any I2 value of >50%, means inconsistent studies

