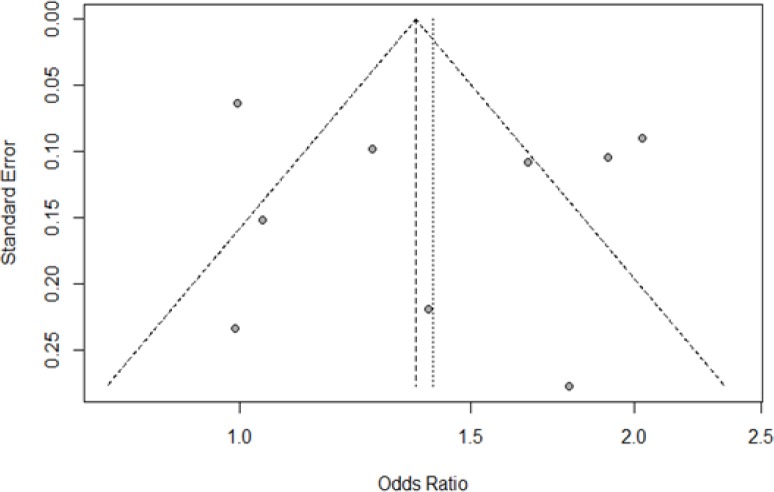
Figure 3.
Funnel Plot for Salted Fish Consumption. Each dot signifies individual study. The standard error of the effect estimate is represented by y-axis. X-axis represents the result/odds ratio for the study. Towards the top are larger studies with higher power while toward the bottom are studies with lower power. The scatter in the plot is because of sampling variation. The shape and scatter of the plot is due to variety of standard errors in the studies. Assuming the studies have the same size of standard errors, all the studies/dots would have dropped on the horizontal line

