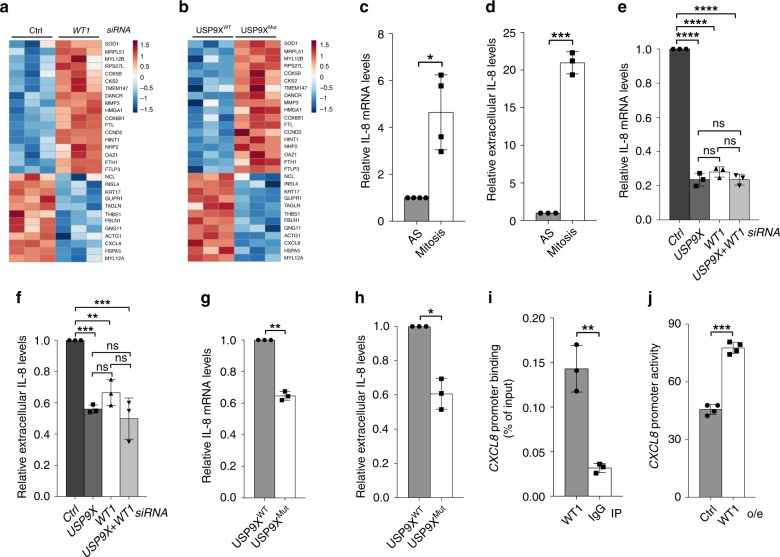
Fig. 3. WT1 regulates IL-8 transcription and secretion in mitosis.
a Heatmap of RNA-Seq analysis depicting differentially regulated genes in mitotic control cells versus WT1 knockdown U2OS cells. Each column displays an independent biological replicate, negatively regulated genes on the top, positively regulated genes on the bottom. b RNA-Seq analysis showing differentially regulated genes in mitotic USP9XWT versus USP9XMut U2OS cells. c Quantitative RT-PCR showing accumulation of IL-8 mRNA in mitotically synchronized versus asynchronous U2OS cells. Mean is shown from n = 4 biologically independent experiments. One sample t-test was applied with *p = 0.0198. d Extracellular IL-8 measured by ELISA is increased in the supernatant of mitotic versus asynchronous U2OS cells. Mean is shown from n = 3 biologically independent experiments. Ratio paired t-test was applied with ***p = 0.0002. e Quantitative RT-PCR from mitotic U2OS cells showing reduced IL-8 mRNA levels in response to USP9X, WT1, or double compared to control knockdown. Mean is shown from n = 3 biologically independent experiments. One-way ANOVA was applied with ****p<0.0001 followed by Dunnett’s test with ****p < 0.0001 (p(USP9X versus WT1) = 0.211; p(USP9X versus USP9X+WT1) > 0.9999; p(WT1 versus USP9X+WT1) = 0.2061). f Secreted IL-8 measured by ELISA in the supernatant of mitotic U2OS cells following USP9X, WT1, or double versus control knockdown. Mean is shown from n = 3 biologically independent experiments. One-way ANOVA was applied with ***p = 0.0001 followed by Dunnett’s test with ***p(Ctrl versus USP9X) = 0.0004, **p(Ctrl versus WT1) = 0.0055, ***p(Ctrl versus USP9X+WT1) = 0.0002; p(WT1 versus USP9X) = 0.3081, p(WT1 versus USP9X+WT1) = 0.0791, p(USP9X versus USP9X+WT1) = 0.6772. g Quantitative RT-PCR showing reduced IL-8 mRNA in USP9XMut versus USP9XWT U2OS cells that were mitotically synchronized using nocodazole. Mean is shown from n = 3 biologically independent experiments. One sample t-test was applied with **p = 0.002. h ELISA showing reduction of secreted IL-8 in the supernatant of mitotically synchronized USP9XMut compared to USP9XWT U2OS cells. Mean is shown from n = 3 biologically independent experiments. Ratio paired t-test was applied with *p = 0.0277. i Chromatin immunoprecipitation (ChIP) showing WT1 occupancy on the CXCL8 promoter in nocodazole-synchronized U2OS cells. ChIP signal was quantified using RT-PCR. WT1 occupancy was normalized to total input DNA. Mean from n = 3 biologically independent experiments is shown. Ratio paired t-test was applied with **p = 0.00277. j CXCL8 reporter assay performed in nocodazole-treated U2OS cells that were transfected with luciferase reporter construct harboring the human CXCL8 promoter or an empty reporter construct and a WT1 overexpressing vector as indicated. Luminescence was normalized to the background luminescence of the empty reporter construct. Mean is from n = 4 biologically independent experiments. Ratio paired t-test was applied with ***p = 0.0007. Throughout this figure standard deviations are displayed as error bars.

