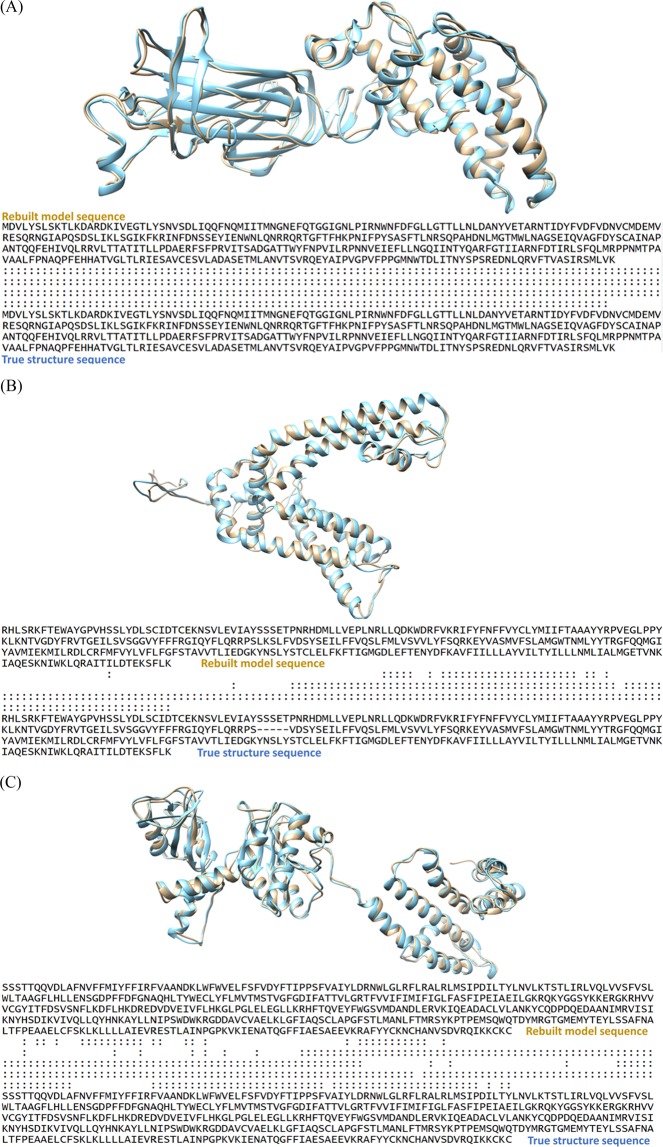
Figure 16.
(A) Visualization of superposition between the mapped Cα Segment 1 of EMD-6272 (brown) and its counterpart in the experimental structure (blue). “:” in the sequence-dependent structure alignment denotes the residue pairs whose distance is less than 5 Angstrom. (B). Visualization of superposition between the mapped Cα Segment 1 of EMD-5778(brown) and its counterpart in the experimental structure (blue). “:” in the sequence-dependent structure alignment denotes the residue pairs whose distance is less than 5 Angstrom. (C). Visualization of the superposition between the mapped Cα segment 1 of EMD-8410 (brown) and its counterpart experimental structure (blue). “:” denotes the residue pairs of distance is less than 5 Angstrom. UCSF Chimera v1.13 (www.cgl.ucsf.edu/chimera) was used to create this figure.

