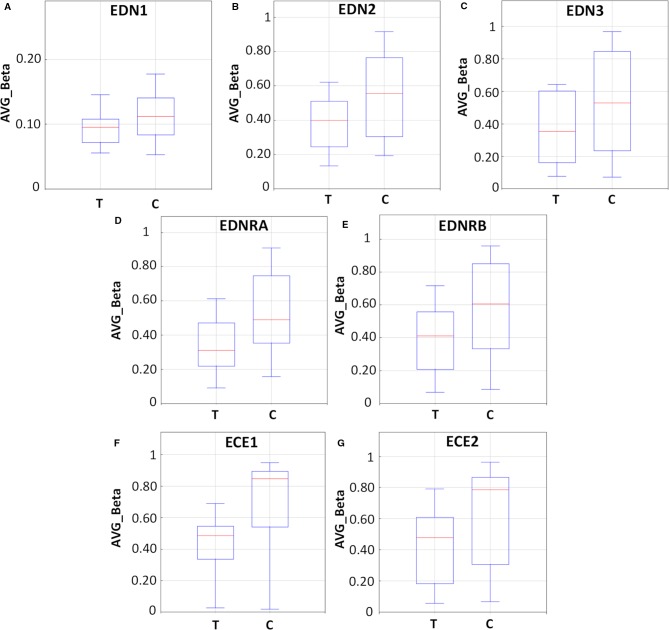
Figure 6.
Methylation analysis of the endothelin system members (EDN1, EDN2, EDN3, EDNRA, EDNRB, ECE1, and ECE2) in LS174T human colorectal cancer (CRC) cells after exposure to decitabine (DAC, 0.25 µM), administered once daily for 72 h. Box plots show the average beta (AVG_Beta) methylation levels of gene loci that were differentially methylated in the genome of DAC-treated (T) and untreated control (C) LS174T cells. An average β-value (AVG_Beta) for each CpG locus ranging from 0 (unmethylated) to 1 (completely methylated) was extracted utilizing the GenomeStudio program (Illumina) for DNA extracted from control (C) and treated (T) LS174 cells. (A–C) Boxplots show the AVG_Beta methylation levels of 12, 13, and 24 CpG loci in the EDN1, EDN2, and EDN3 genes, respectively, in treated and control LS174T cells. (D, E) Boxplots show the AVG_Beta methylation levels of 30 and 63 CpG loci in the EDNRA and EDNRB genes, respectively in treated and control LS174T cells. (F, G) Boxplots show the AVG_Beta methylation levels of 121 and 38 CpG loci in the ECE1 and ECE2 genes, respectively in treated and control LS174T cells.

