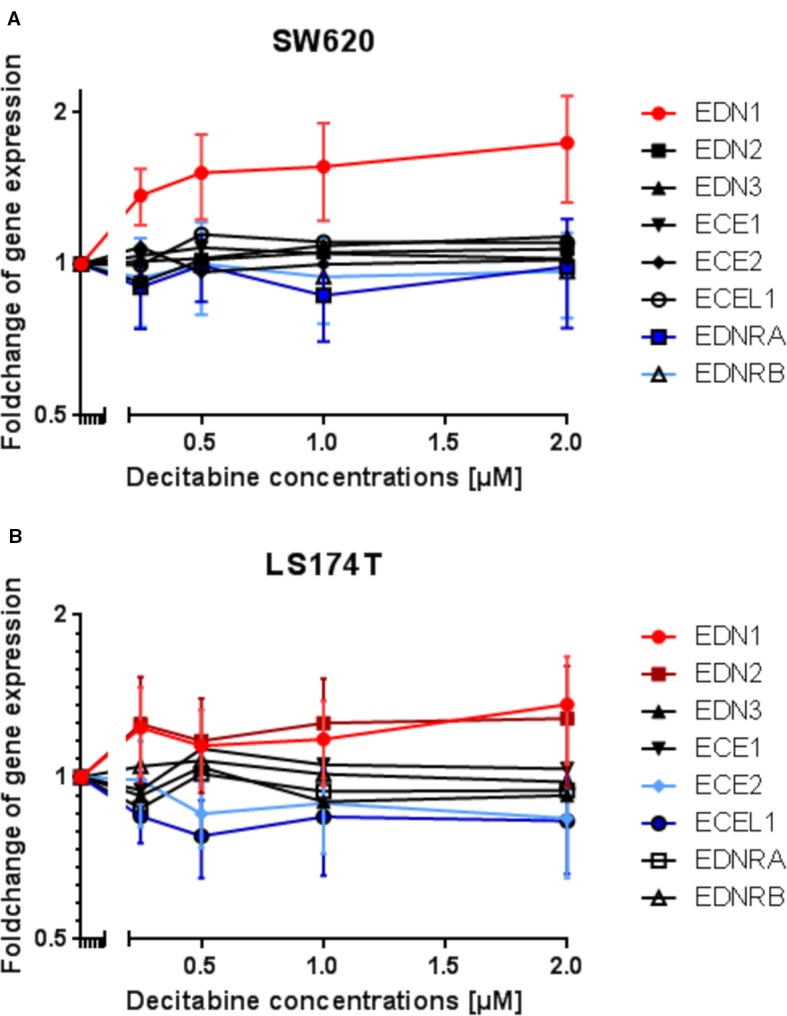
Figure 7.

Modulation of endothelin system members (EDN1, EDN2, EDN3, ECE1, ECE2, ECEL1, EDNRA, and EDNRB) after exposure to three daily doses of incrementing decitabine (DAC) concentrations (0.5, 1.0, 1.5, 2.0 µM) in two human (SW620 and LS174T) colorectal cancer cell lines as observed by microarray analysis. (A) Fold-change of gene expression of endothelin system members in SW620 cells. (B) Fold-change of gene expression of endothelin system members in LS174T cells. The values represent the fold change in gene expression as determined by microarray in CRC cells that were exposed to DAC. The x-axis gives the decitabine (DAC) concentration (µM). The y-axis gives the messenger RNA (mRNA) expression of the studied gene relative to that level found in control cells.
