Figure 4.
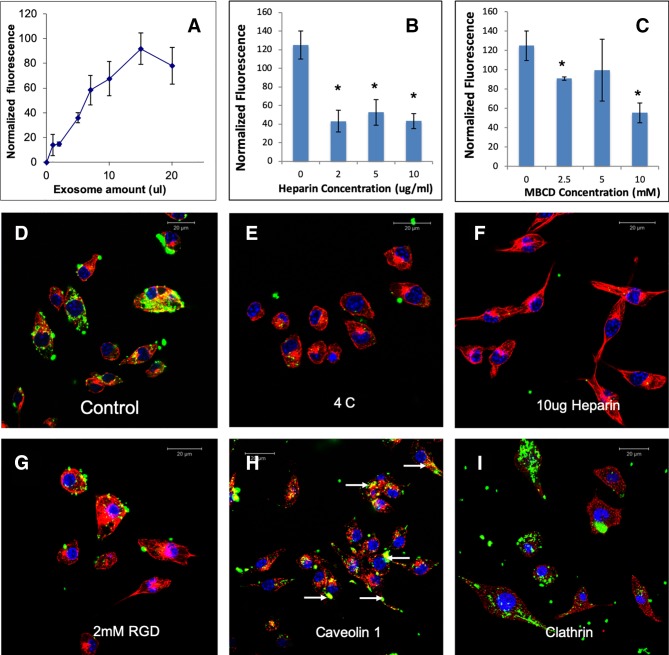
Endocytosis of HMSC extracellular vesicles (EVs) by J774A.1 monocytes: (A) Graphical representation of dose-dependent and saturable endocytosis of fluorescently labeled human mesenchymal stem cell (HMSC) EV by J774A.1 cells. Data points represent mean fluorescence (n=6) +/− SD. The EV volume was standardized as described under the methods section. (B) Graph showing the dose dependent inhibition of HMSC EV endocytosis after pre-treatment of the EVs with heparin to block interaction with the cell surface heparan sulfate proteoglycans (HSPGs). Data represent mean percentage fluorescence with respect to control +/− SD. (C) Graph showing the reduction in HMSC endocytosis after disruption of target cell membrane cholesterol with varying doses of methyl-β-cyclodextrin (MBCD). Data is presented as mean percentage fluorescence with respect to control +/− SD. Representative confocal micrograph depicting the endocytosed fluorescently labeled HMSC EVs within target HMSCs after 1 h of incubation at 37°C. (E) Representative confocal micrograph indicating the abrogation of HMSC EV endocytosis when the experiment is performed at 4°C. (F) Representative confocal micrograph showing that pre-treatment of EVs with heparin blocks HMSC EV endocytosis. (G) Representative confocal micrograph of HMSC EV endocytosis after pre-treatment of the cells with 2 mM RGD peptide to block cell surface integrins. In images (D–G), green fluorescence represents endocytosed EVs. Red fluorescence represents tubulin counter stain and blue fluorescence indicates 4′,6-diamidino-2-phenylindole (DAPI) nuclear stain. (H) Confocal micrograph showing colocalization of endocytosed HMSC EVs (green) with caveolin1 (red). (I) Confocal micrograph showing the absence of co-localization between endocytosed EVs (green) and clathrin (red). * represents statistical significance (P < 0.05, ANOVA followed by Tukey’s ad-hoc) with respect to control.

