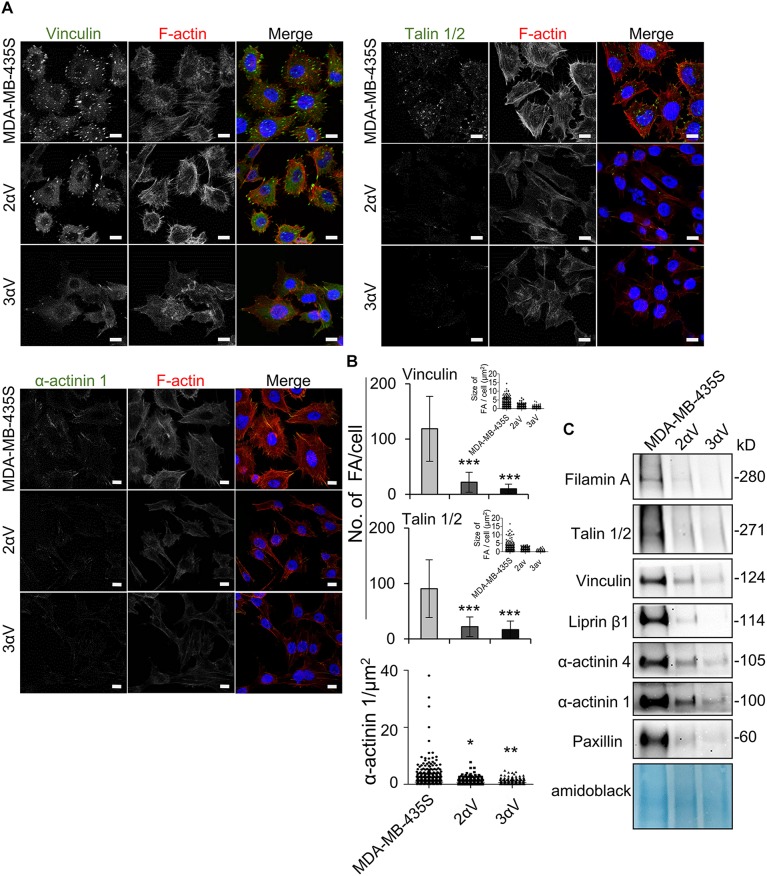
FIGURE 5.
MS data validation in MDA-MB-435S cells and clones 2αV and 3αV. (A) Clones 2αV and 3αV show decreased expression of vinculin, talin 1/2 and α-actinin 1 as compared to MDA-MB-435S cells. Forty-eight hours after seeding on coverslips, cells were fixed, permeabilized, incubated with antibodies against vinculin, talin 1/2 or α-actinin 1 antibody, followed by Alexa-Fluor 488-conjugated antibody (green). F-actin staining (red) was performed in all samples, and nuclei were stained with DAPI (blue). Analysis was performed using TCS SP8 Leica. Scale bar = 10 μm. (B) Quantification data of results in (A) presented as histograms (FA number) and scatter plots (FA or α-actinin 1 size) represent measurements of > 50 cells and are plotted as mean ± SD (n = 3). Data were analyzed by one-way ANOVA with Dunnett’s multiple comparison. *P < 0.05; **P < 0.01; ***P < 0.001. (C) WB analysis of IAC proteins from clones 2αV and 3αV and MDA-MB-435S cells. Forty-eight hours after seeding, IACs were isolated and WB analysis was performed. The results presented are representative of three independent experiments yielding similar results.

