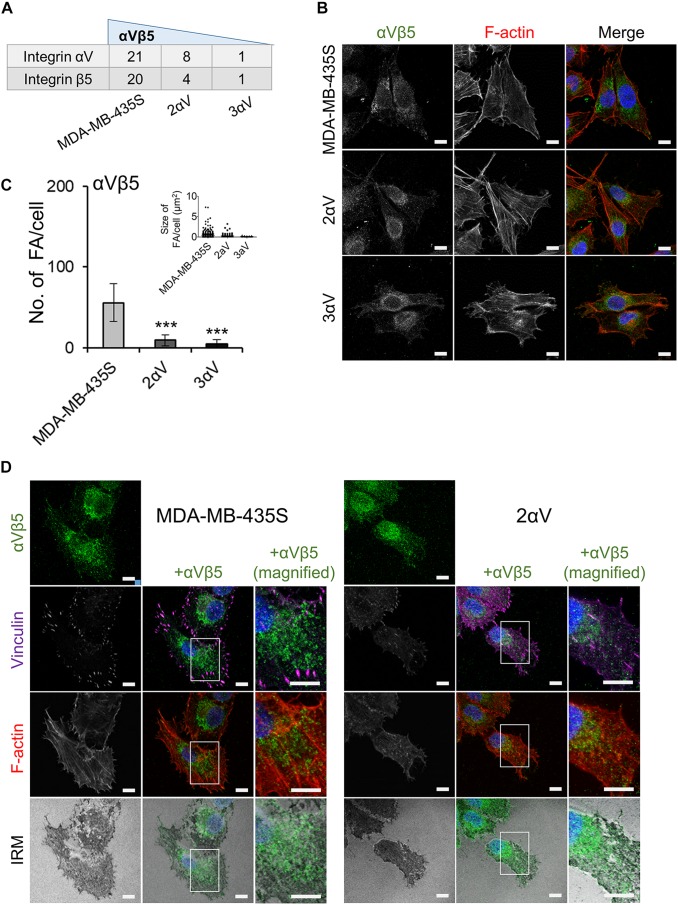
FIGURE 6.
Characterization of αVβ5-associated adhesion complexes. (A) The most abundant integrin subunits found in IACs. Dataset consists of at least two different experiments. Average spectral count number shown. (B) Clones with integrin subunit αV knockdown show decreased expression of integrin αVβ5. Forty-eight hours after seeding on coverslips, cells were fixed, permeabilized, and stained with anti-αVβ5 antibody, followed by Alexa-Fluor 488-conjugated antibody (green). F-actin staining (red) was performed, and nuclei were stained with DAPI (blue). Analysis was performed using TCS SP8 Leica. Scale bar = 10 μm. (C) Quantification data of results in (B) presented as histogram (FA number) and scatter plot (FA size) represent measurements of > 50 cells and are plotted as mean ± SD (n = 2). Data were analyzed by one-way ANOVA with Dunnett’s multiple comparison. ***P < 0.001. (D) Identification of reticular adhesion structures in MDA-MB-435S cells and clone 2αV. Forty-eight hours after seeding on coverslips, cells were fixed, permeabilized, and stained for anti-αVβ5 followed by Alexa-Fluor 488-conjugated antibody (green), and anti-vinculin followed by Alexa-Fluor 647-conjugated antibody (purple). F-actin staining (red) was performed, nuclei were stained with DAPI (blue) and IRM images were taken. Analysis was performed using TCS SP8 Leica. Scale bar = 10 μm.

