FIGURE 2.
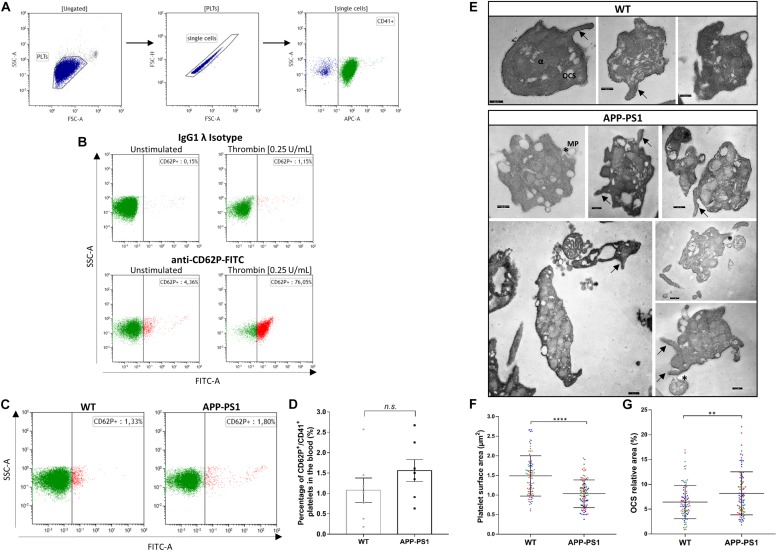
Activation status and ultrastructure analysis of peripheral blood platelets in APP-PS1 mice. Surface expression of CD62P by CD41+ platelets was assessed by flow cytometry to determine the activation status of blood-isolated platelets. Gating strategy for single CD41+ platelets (A). Positive control for platelet activation: Unstimulated or thrombin-stimulated platelets were stained with CD62P or respective IgG isotype control antibody (B). Both APP-PS1 and WT animals showed CD62P+/CD41+ platelets under unstimulated conditions (C), but the percentage of activated platelets in the bloodstream of APP-PS1 and WT were not significantly different (D). However, TEM analysis revealed ultrastructural differences between APP-PS1 and WT blood-isolated platelets. APP-PS1 platelets presented a more irregular cell membrane, with formation of membrane elongations (arrows), and released microparticles (asterisks, *), the last two being signs of platelet activation (E). APP-PS1 platelets also exhibited a significantly smaller surface area (F) and an enlarged OCS (G) compared with WT platelets. The annotated structures are α-granules (α), open canalicular system (OCS), and microparticule (MP). Scale: 250 nm (E). Graph bars represent mean ± SEM. Statistical analysis was performed by unpaired Student’s t test (B: n = 7/group; including three females and four males per group) and Mann–Whitney test (F and G: n = 90 platelets/genotype, including WT: three females and APP-PS1: two females and one male, with the 30 platelets analyzed per animal being color coded). ****p < 0.0001; **p < 0.01.

