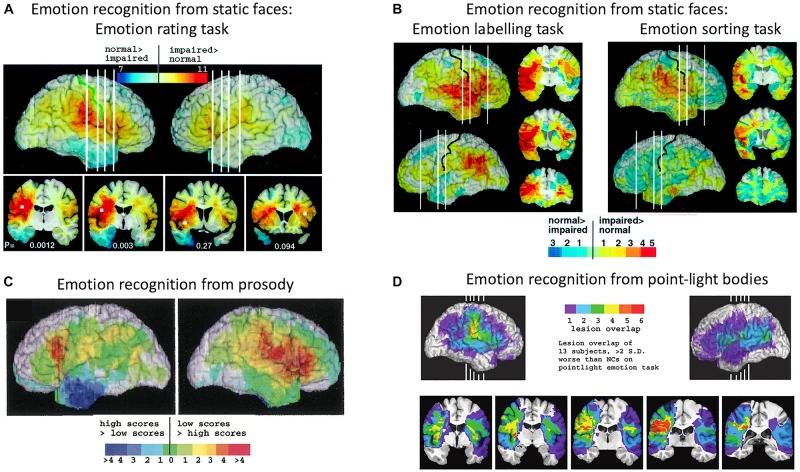
FIGURE 2.
Distribution of lesion overlaps for emotion recognition tasks in studies by Adolphs and colleagues. (A) Distribution of lesion overlaps from all 108 subjects in Adolphs et al. (2000) study as a function of mean recognition performance on an emotion-rating task for static facial expressions. Red regions correspond to locations at which lesions resulted in impairment on the task more often than not, and blue regions correspond to locations at which lesions resulted in normal performance more often than not. (B) Distribution of lesion overlaps from all 108 subjects in Adolphs et al. (2000) study as a function of mean performance on tasks requiring either choosing the name of the facially expressed emotion or sorting the expressions into categories without requiring naming. Color coding as for (A). (C) Distribution of lesion overlaps from Adolphs et al. (2002) study as a function of mean performance on an emotion-rating task for prosodic expressions, for the 33 individuals with the most abnormal ratings (red) compared with the 33 with the most normal ratings (blue). (D) Distribution of lesion overlaps from Heberlein et al. (2004) study for the subjects who were impaired at emotion recognition from the point-light walker stimuli (>2 SD below normal control mean). Figures (A,B): Copyright 2000 Society for Neuroscience. Figure (C): Copyright 2002 American Psychological Association. Figure (D): Copyright 2004 MIT Press.

