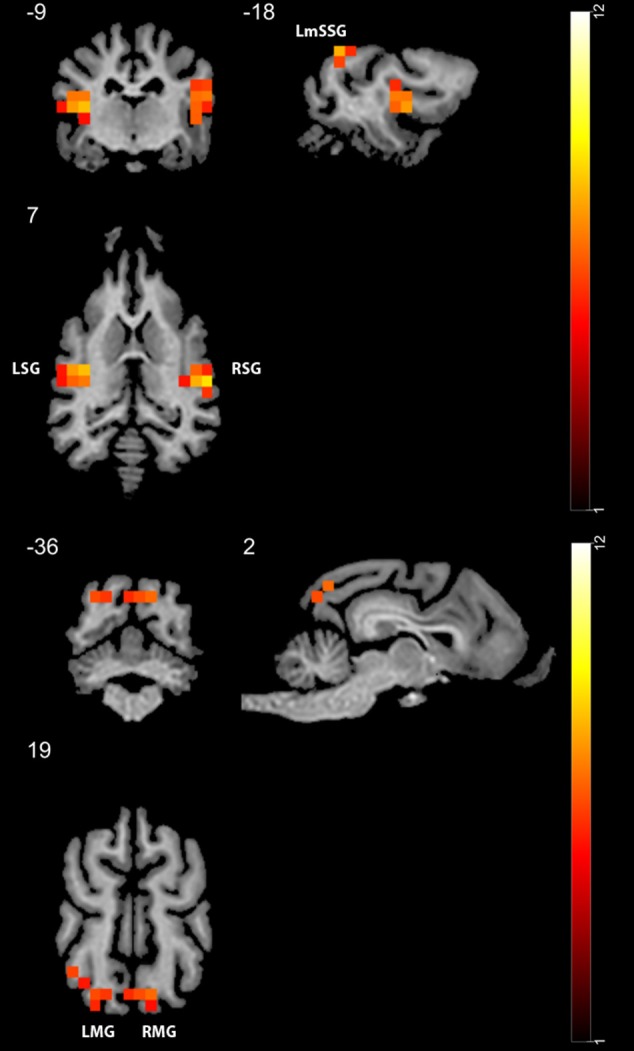
Figure 4.

GLM results in study 1 (n = 13). Regions showing higher activity to the face stimulus compared to the mono-colored control. Color heatmap and color bar indicates t-values, displayed on selected slices overlaid on the template brain. Thresholdet at uncorrected voxel threshold p < 0.0001, FWE corrected at the cluster level. RSG, right Sylvian gyrus; LmSSG, left mid suprasylvian gyrus; LMG, left marginal gyrus; RMG, right marginal gyrus; LSG, left Sylvian gyrus.
