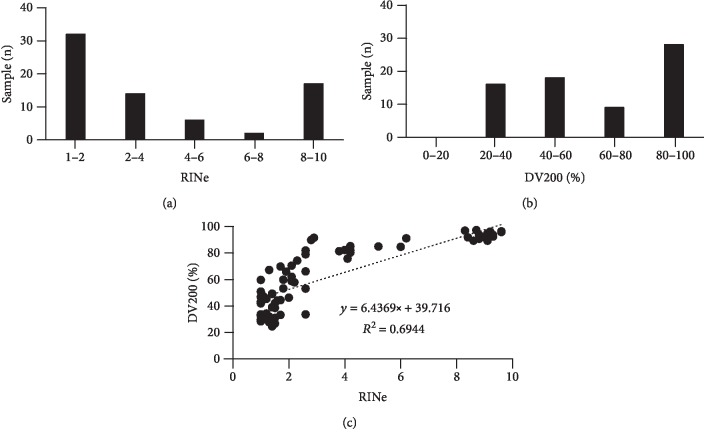
Figure 1.
Relationship between RINe and DV200 values. (a, b) Distribution of RINe and DV200 values. Graphs show the distribution of RINe and DV200 values categorized in 2-point and 20-point increments, respectively. (c) Correlation between RINe and DV200 values. RINe and DV200 values were determined using TapeStation 2200.

