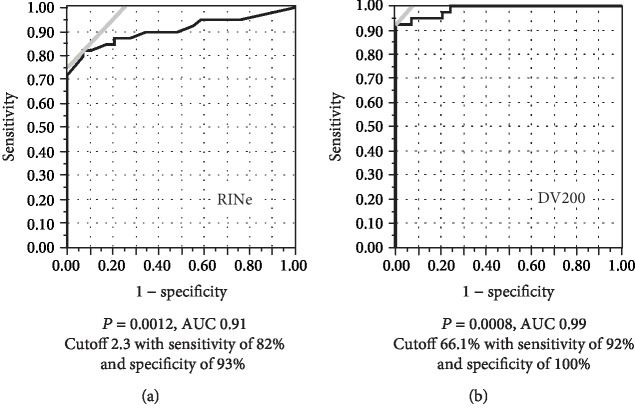
Figure 3.
Receiver operating characteristic curves for RINe and DV200. ROC curves for the RINe and DV200 indexes indicating the most efficient amount (more than 10 ng/ng) of the 1st PCR library product per input. The area under the curve for DV200 was greater than that for the RINe index (0.99 with P = 0.0008 and 0.91 with P = 0.0012, respectively).

