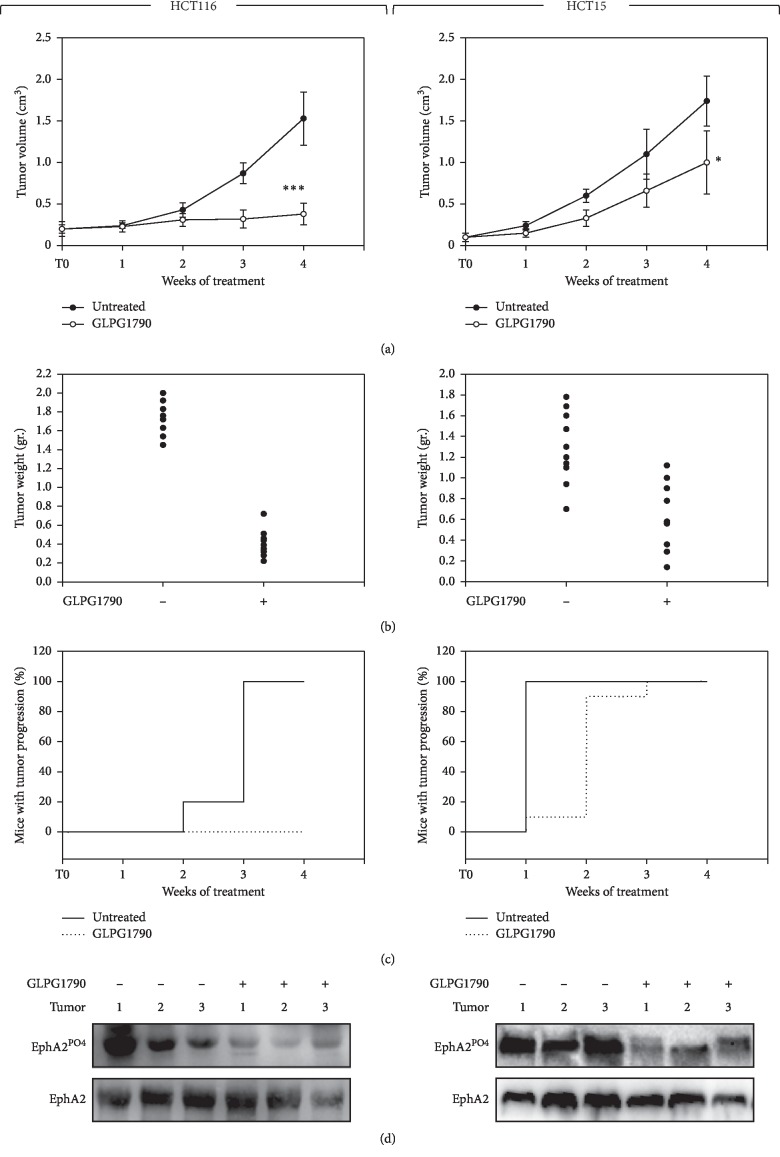
Figure 6.
Effects of GLPG1790 on in vivo tumor growth. (a) Growth curves indicating tumor volume from xenografted HCT116 or HCT15 cell lines that have been untreated (vehicle) or GLPG1790-treated (GLPG1790) have been compared. Tumor volumes were evaluated as described in the methods section, and values represent the mean ± SEM from 10 mice. The upper panel shows the sequential treatments of xenografted mice, which began when tumors reached a volume of approximately 0.2–0.3 cm3. GLPG1790 (30 mg/kg) was administered 5 days a week for 4 weeks. (b) Tumor weights of mice that had remained untreated or had been treated with GLPG1790 have been shown. (c) Kaplan–Meier estimates for rates of progression of untreated and GLPG1790-treated HCT116-derived tumors. (d) Phosphorylation/activation status of EphA2 in tumors from vehicle- or GLPG1790-treated mice. A representative Western blot experiment from the 6 tumors analyzed has been shown.

