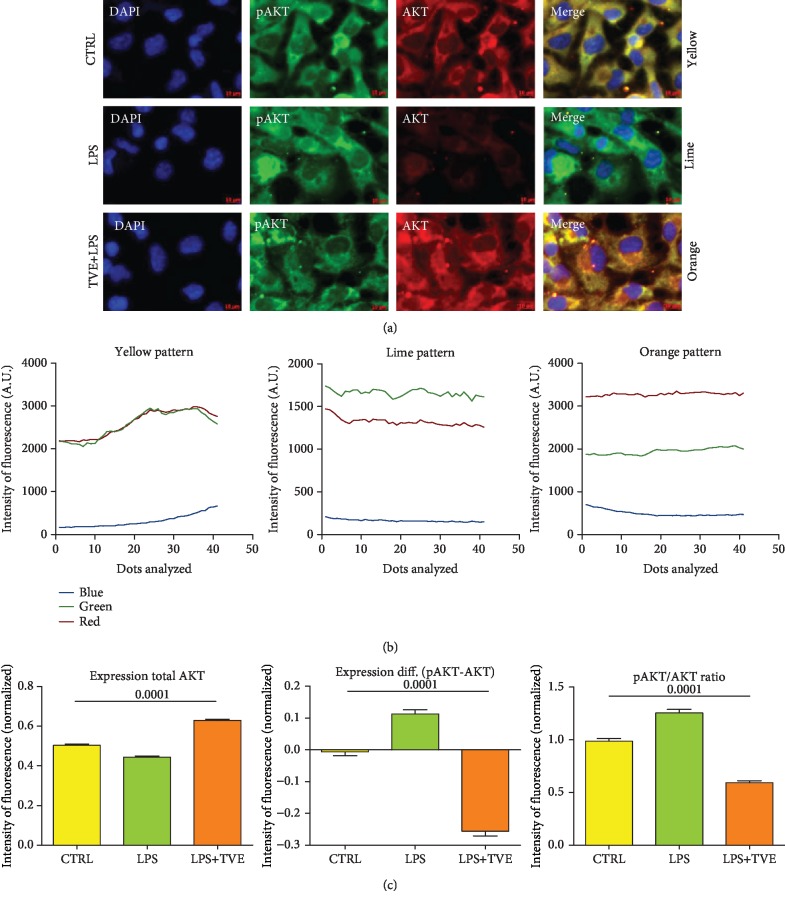
Figure 2.
AKT protein modulation. (a) Confocal immunofluorescence representation of AKT protein modulation (total and phosphorylated forms) in Controls and the TVE- and TVE+LPS-treated BV-2 cells. (b) The overlapping spectra (blue: DAPI; green: pAKT; and red: total AKT) highlighted three major color spectra: yellow (Y) when pAKT≅total AKT, lime (L) when pAKT > total AKT, and orange (O) when pAKT < total AKT. (c) LPS treatment upregulated pAKT form (L), wherever TVE restored the AKT status increasing the unphosphorylated form of protein (O). TVE treatment affected the pAKT/AKT ratio as well.

