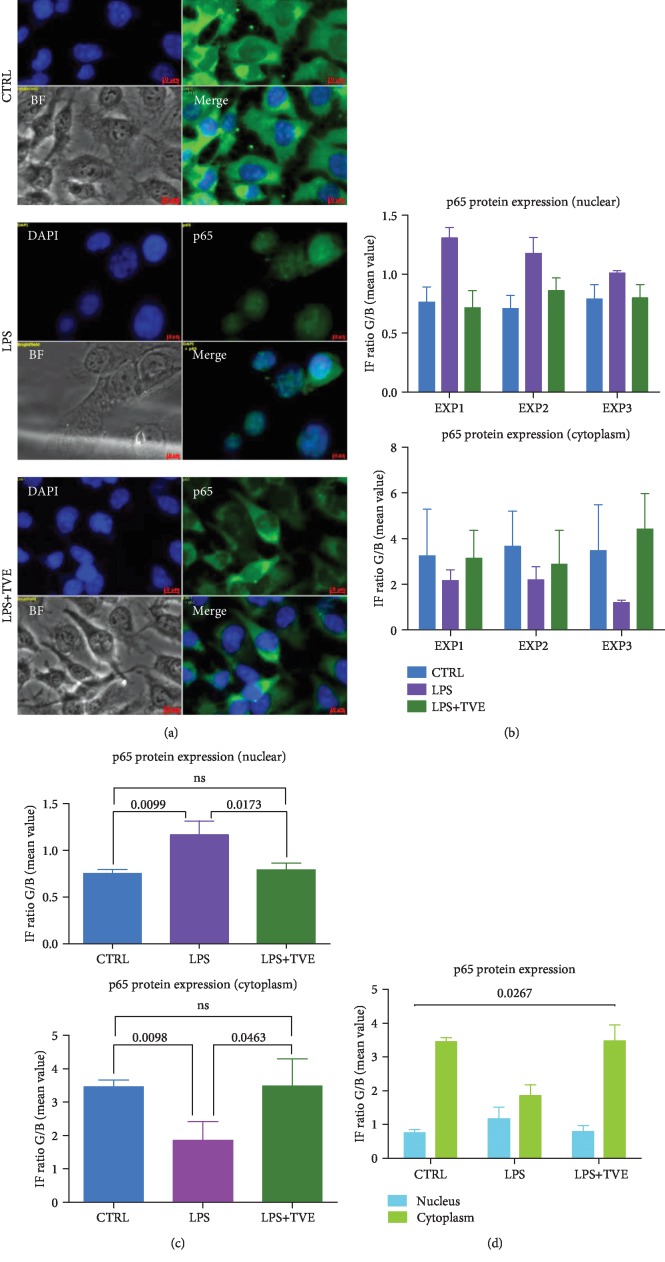
Figure 4.
p65 protein analyses. (a) IF on BV-2 cells. (b) Raw data according to both nuclear and cytoplasmic expressions by three different experiments. (c) Quantification p65 protein expression in BV-2. (d) Distribution and localization of p65 in BV-2 cells after treatments. Significant p values were reported inside the graph. ns: not significant differences.

