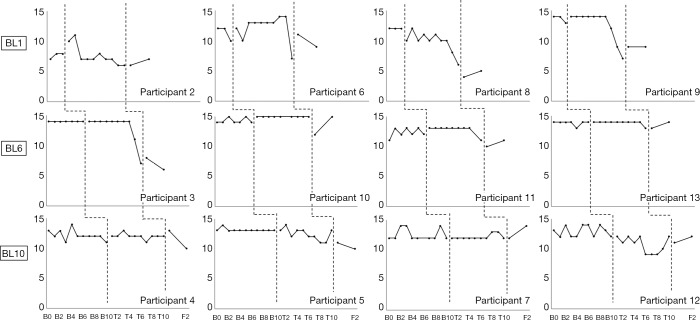
Figure 3.
Individual outcomes through baseline, during treatment, and at 1-month and 3-month follow-up. Each graph represents data for one participant. Each row represents one baseline length, i.e., 2, 6 and 10 weeks. B-PSWQ, Brief Penn State Worry Questionnaire; B-IUS, Brief Intolerance for Uncertainty Scale. B, baseline; T, treatment; F, follow-up.

