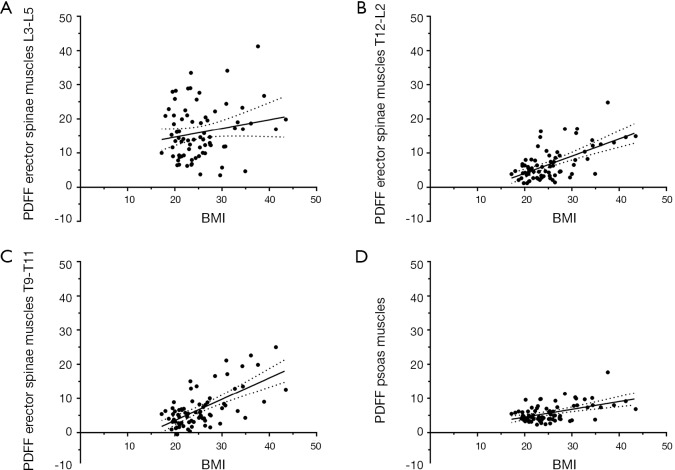
Figure 3.
Body mass index (BMI) versus proton density fat fraction (PDFF). Graphs plotting the BMI (in kg/m2, x-axis) against the PDFF (in %, y-axis) for the erector spinae muscles of the segments L3–L5 (A), T12–L2 (B), and T9–T11 (C) as well as the psoas muscles (D). Points represent the respective values of the single subjects, which are shown together with the best-fit line and its 95% confidence band.

