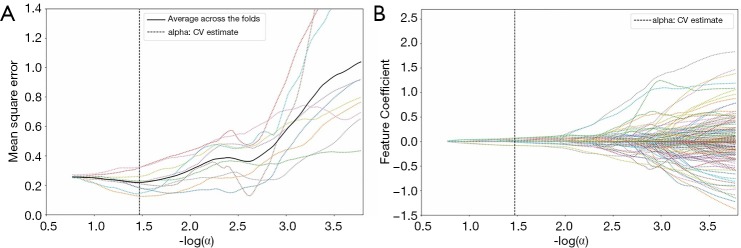
Figure 6.
(A) The relationship between the mean square of the LASSO 10-fold cross-validation and the value of -log(α); (B) the relationship between the feature coefficient and the value of -log(α). The thick solid line is the mean curve of the LASSO 10-fold cross-validation curve, and the thin dotted line is the LASSO regularized curve of each fold in (A). The thin dotted line is the feature coefficient value of each fold at different -log(α) values in (B). The thick dotted line is the value of -log(α) at the minimum mean square error. LASSO, least absolute shrinkage and selection operator.

