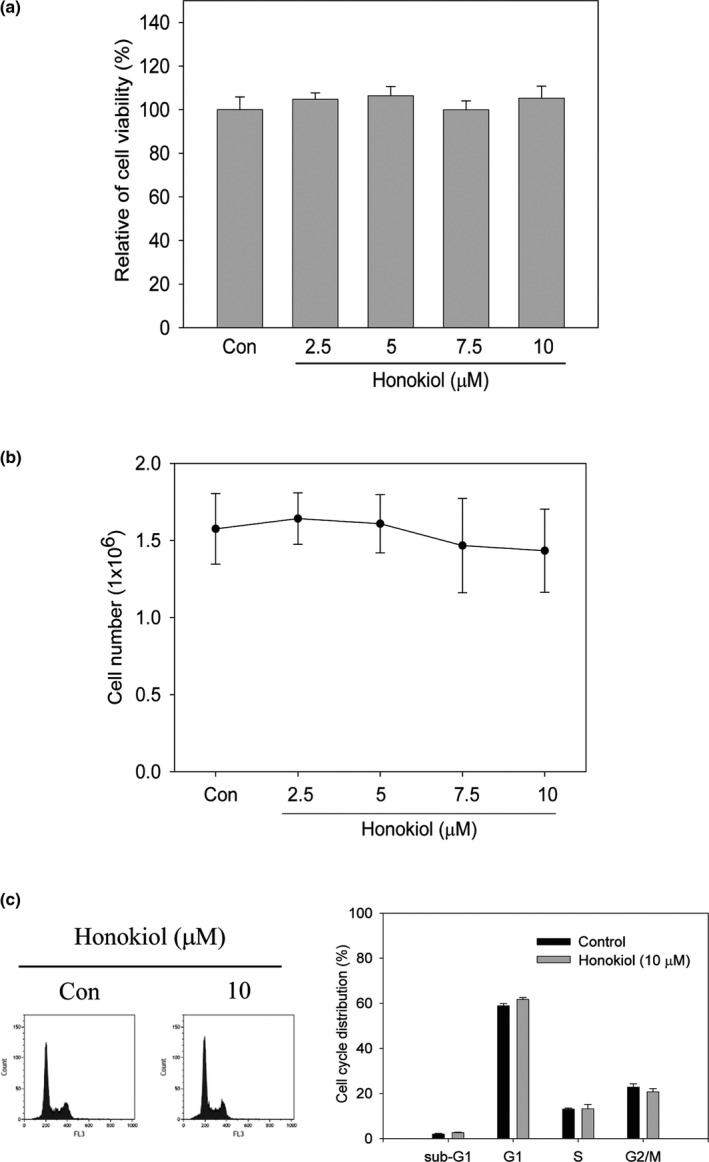
Figure 2.

Effects of honokiol on cell viability and cell cycle distribution in H1299 cells. H1299 cells were cultured and treated with honokiol (0, 2.5, 5, 7.5, 10 μM) for 24 hr. (a) cell viability and (b) cell proliferation were detected by MTT assay and trypan blue exclusion assay, respectively. (c) H1299 cells were incubated with 10 μM of honokiol for 24 hr. Thereafter, cells were harvested and flow cytometry was performed to determine cell cycle distribution. Data were represented by the mean ± SD of triplicate samples. Significant difference was compared with the control group (*, p < .05)
