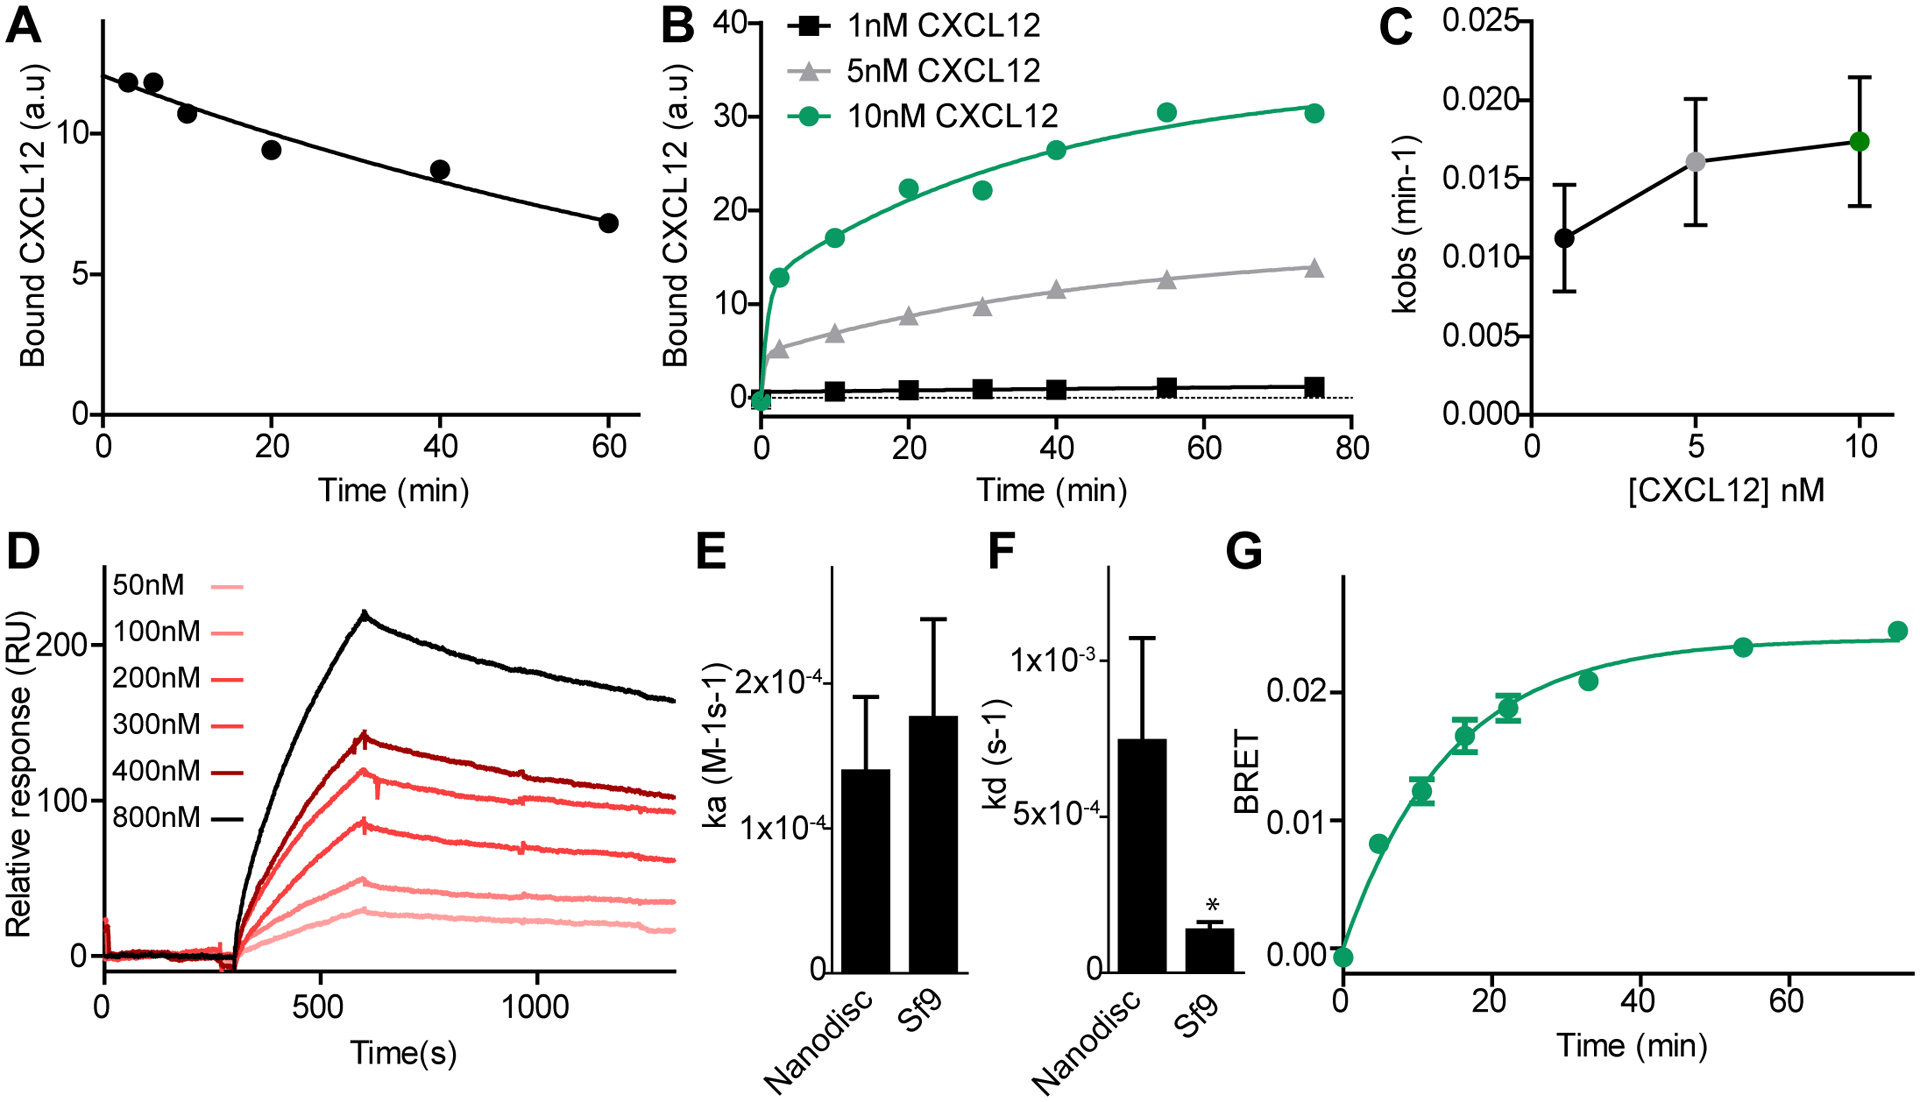
Fig. 2. Kinetics of CXCL12 binding to ACKR3.

(A) Dissociation of CXCL12WT was measured by flow cytometry by monitoring the decrease in geometric mean of FITC fluorescence after addition of the small molecule ligand CCX777 to live Sf9 cells co-expressing ACKR3WT and HA-tagged CXCL12WT bound to FITC-conjugated antibody. (B) Association of CXCL12WT to ACKR3WT after adding HA-tagged CXCL12WT complexed with FITC-conjugated antibody against HA to cells expressing ACKR3WT. (C) kobs values for the slow phase of CXCL12WT association to ACKR3WT at different ligand concentrations determined from fitting the data to a two component exponential equation. (D) Binding of ACKR3 in nanodiscs to immobilized CXCL12 measured by SPR. (E and F) Association (E) and dissociation rate constants (F) were determined for binding of ACKR3 in nanodiscs to immobilized CXCL12 detected by SPR, and for CXCL12 binding to ACKR3 in live Sf9 cells detected by flow cytometry. The asterisk indicates that the dissociation rate is slower in Sf9 cells as determined from unpaired t-test with p < 0.05. (G) Kinetics of β-arrestin-2 recruitment to ACKR3WT in HEK293T cells followed by BRET. Curves in (A), (B), (D) and (G) are representative examples of six (A) or three (B, D and G) independent results, and each point or bar in (C), (E) and (F) are means and standard errors of three or more experiments.
