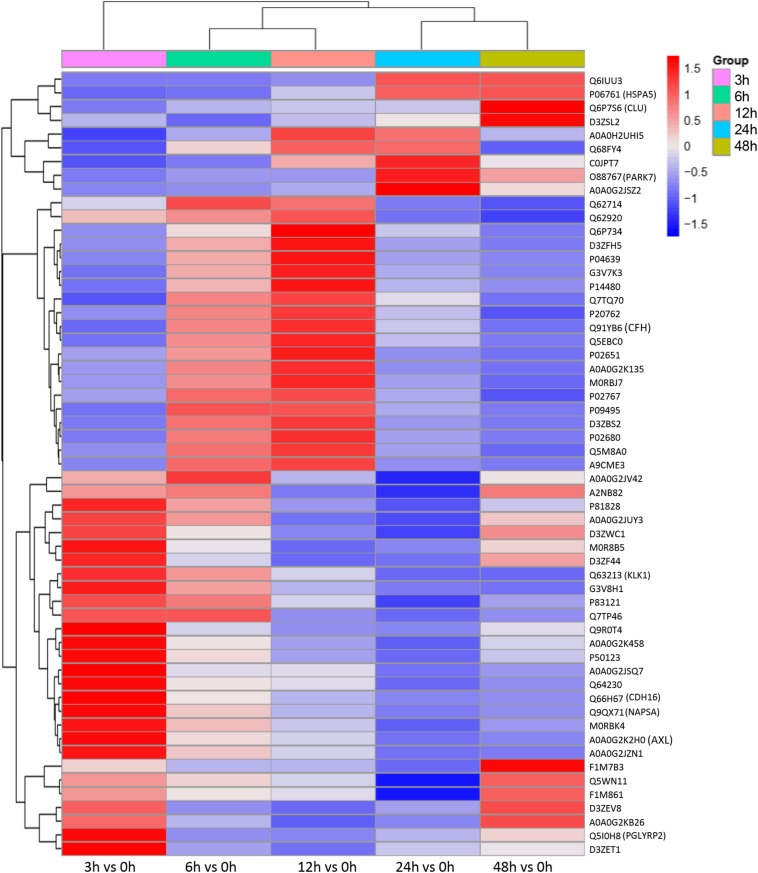
FIGURE 6.
Differentially expressed proteins with a continuous change, which began from the onset of kidney injury and lasted for the whole course of the disease, were sorted, and a heatmap showed the relative expression of these proteins in the indicated time. Protein IDs were showen in the right side of heatmap. P < 0.05.

