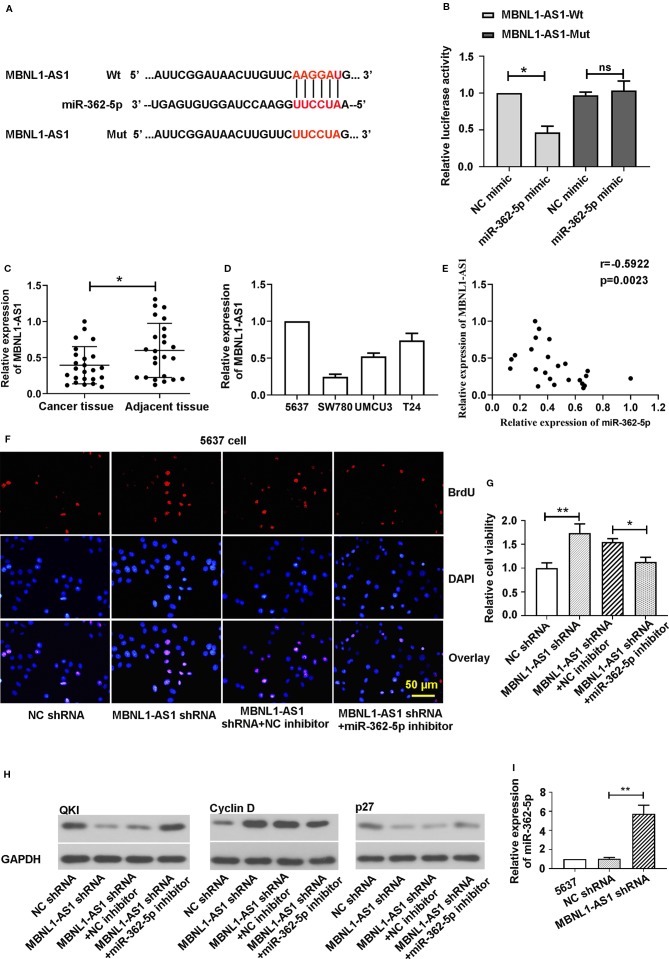
Figure 6.
MBNL1-AS1 acts as a sponge for miR-362-5p. (A) The predicted binding sites within miR-362-5p and wild-type of MBNL1-AS1 (MBNL1-AS1-Wt) and the mutant sequence of MBNL1-AS1 (MBNL1-AS1-Mut). (B) The pmirGLO luciferase vector was inserted with fragments of MBNL1-AS1-Wt or MBNL1-AS1-Mut. Then the constructed pmirGLO luciferase vectors (1 μg) were co-transfected with miR-362-5p mimic (50 pmol) or NC mimic. Luciferase reporter assay was performed after for 48 h transfection. *p < 0.05 vs. controls. (C) The expression levels of MBNL1-AS1 in bladder cancer tissues (N=24) and adjacent tissues (N=24) were analyzed by qRT-PCR. **p < 0.01 vs. adjacent tissues. (D) The relative expression levels of MBNL1-AS1 in bladder cancer cell lines 5637, SW780, UMUC3, and T24 were analyzed by qRT-PCR. (E) Spearman correlation coefficient analysis was used to evaluate associations between miR-362-5p and MBNL1-AS1 verifed by qRT-PCR (r = −0.5922, p = 0.0023). (F) The 5637 cells were co-transfected MBNL1-AS1 shRNA/NC shRNA (1 μg) and miR-362-5p inhibitor/NC inhibitor (50 pmol) for 48 h. Cell proliferation was detected by stainning BrdU in immunofluorescence assay (bar=50 μm). (G) The cell viability of transfected cells was measured by MTT assay at 48 h. The cell viability was displayed as fold of NC shRNA. (H) The protein levels of QKI, Cyclin D, and p27 was measured by western blot. GAPDH was used as an internal control in western blot. (I) The relative expression levels of miR-362-5p in MBNL1-AS1 shRNA or NC shRNA transfected 5637 cells were analyzed by qRT-PCR. The relative expression was displayed as fold of 5637 cells. **p < 0.01 and *p < 0.05 vs. corresponding controls.

