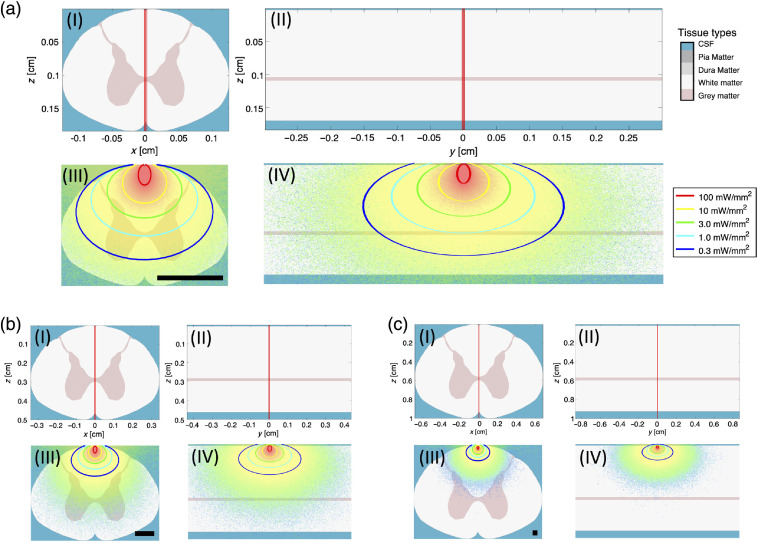
Fig. 2.
Monte Carlo simulation of fluence rate in different mammalian spinal cords using modified mcxyz. (a) Light deposition in mouse spinal cord. Also included here is the color-coded tissue type for each of the simulations and the legend for the optogenetic activation volume. (b) Light deposition in macaque spinal cord. (c) Light deposition in human spinal cord. (I) Tissue-type defined volume with photon trajectory in longitudinal plane. (II) Tissue-type defined volume with photon trajectory in radial plane. (III) Results of simulation in longitudinal plane with activation circles for optogenetic planning. (IV) Results of simulation in radial plane with activation circles for optogenetic planning. Input power is 10 mW in all simulations. Scale bars in (III) are 1 mm.

