Figure 3.

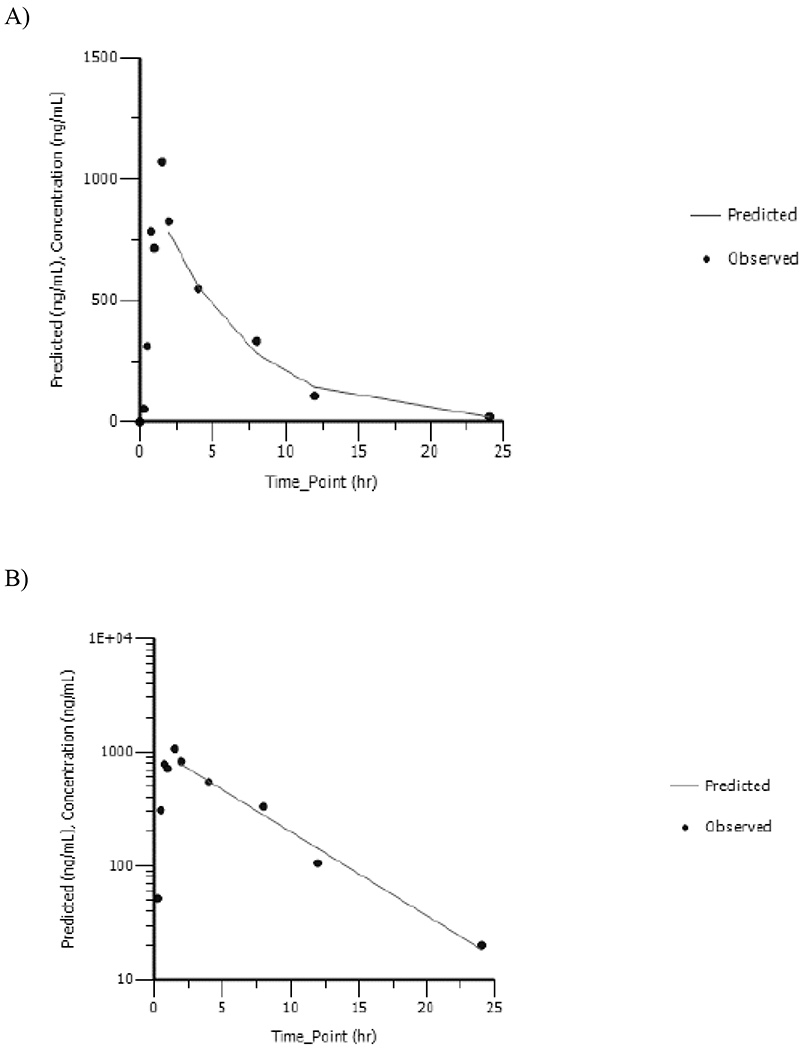
Dam Plasma Concentration versus Time Profiles of Apovincaminic Acid Following a Single Daily Gavage Dose of A) 5mg/kg or B) 20mg/kg Vinpocetine in HSD rat Dams from GD6 to GD18. Data Were Analyzed Using Noncompartmental Analysis.

Dam Plasma Concentration versus Time Profiles of Apovincaminic Acid Following a Single Daily Gavage Dose of A) 5mg/kg or B) 20mg/kg Vinpocetine in HSD rat Dams from GD6 to GD18. Data Were Analyzed Using Noncompartmental Analysis.