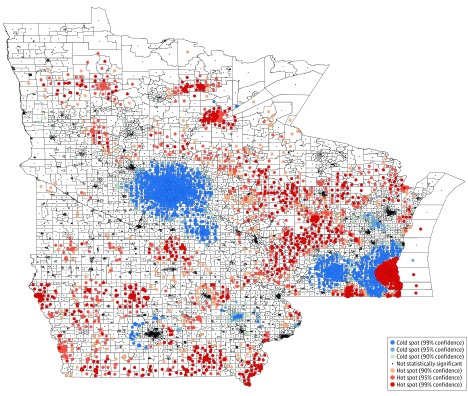
Figure. Census Block Group–Level Hot Spot Analysis of 2016 Area Deprivation Indexes Across Minnesota, Iowa, and Wisconsin.
Hot spots (red) indicate spatial clusters of census block groups with greater deprivation, and cold spots (blue) indicate spatial clusters of census block groups with less deprivation. White areas represent areas without statistically significant clustering. Higher area deprivation indexes indicate greater deprivation. In the key, “% confidence” means the statistical significance with a 99%, 95%, or 90% confidence level.

