
Figure 5. Temporal Trend of PM2.5.
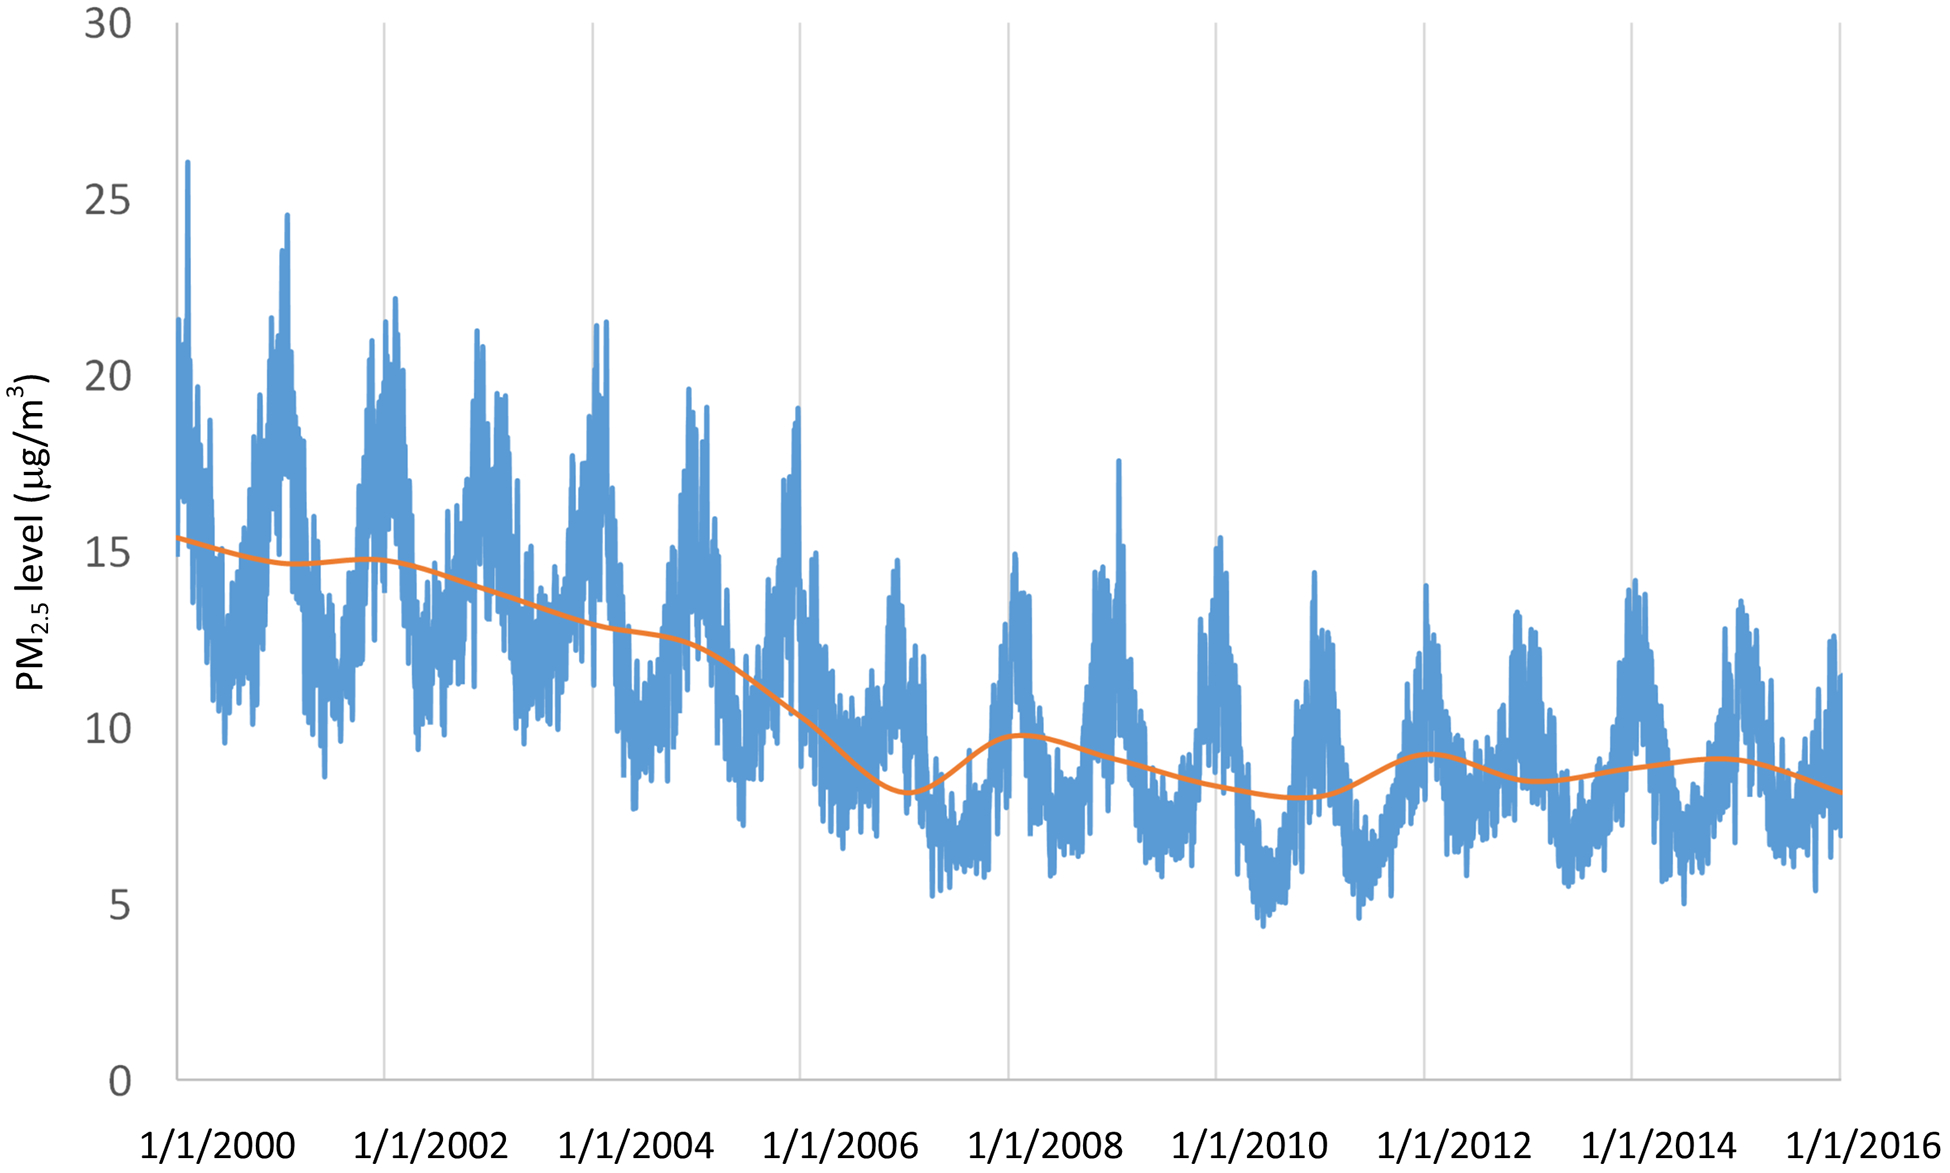
We calculated the daily nationwide averages (blue line), by averaging daily predictions at all 1 km × 1 km grid cells; then we calculated nationwide annual averages (orange line).
Official websites use .gov
A
.gov website belongs to an official
government organization in the United States.
Secure .gov websites use HTTPS
A lock (
) or https:// means you've safely
connected to the .gov website. Share sensitive
information only on official, secure websites.
We calculated the daily nationwide averages (blue line), by averaging daily predictions at all 1 km × 1 km grid cells; then we calculated nationwide annual averages (orange line).