Fig. 9.
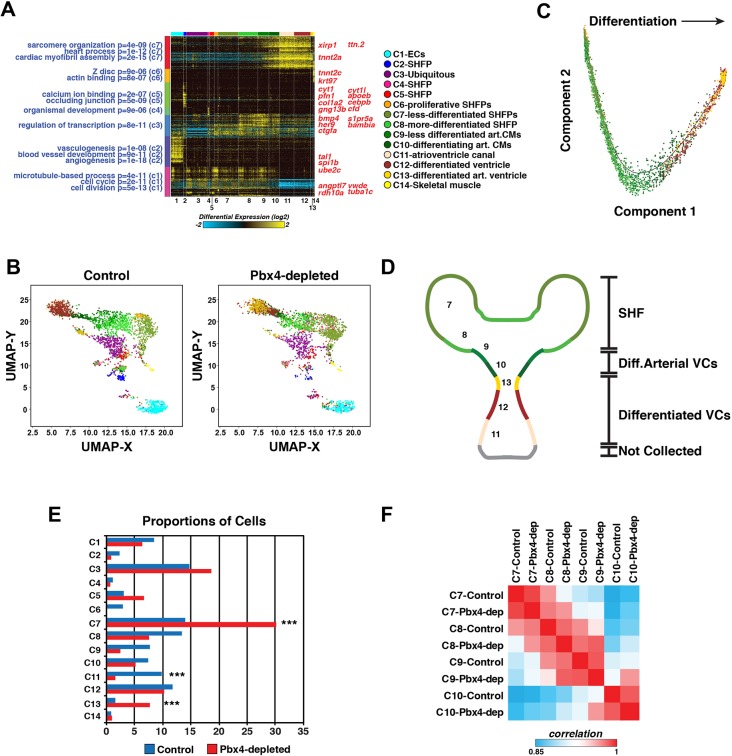
scRNA-seq reveals distinct differentiation states within the SHF and heart tube. (A) Heat map of predicted cell clusters from ICGS and identified guide-genes (right). Statistically enriched biological pathways from the software GO-Elite are shown on the left-hand side. (B) UMAP plots of nkx2.5:ZsYellow+ cells from control and Pbx4-depleted embryos. The Pbx4-depleted cells were aligned to the control cells in AltAnalyze. Colors correspond to the clusters shown in A. (C) Pseudo-time differentiation projection of the cardiac lineage clusters 6-13. (D) Schematic of the location of predicted cell types reflected in the cardiac lineage clusters 7-13. (E) Relative proportions of cells within each cluster from control and Pbx4-depleted nkx2.5:ZsYellow+ cells. Asterisks indicate the most significant differences using Fisher's exact test with P<10−28. (F) Pairwise comparison of gene expression within clusters 7-10 from control and Pbx4-depleted nkx2.5:ZsYellow+ cells using cellHarmony.

