Fig. 2.
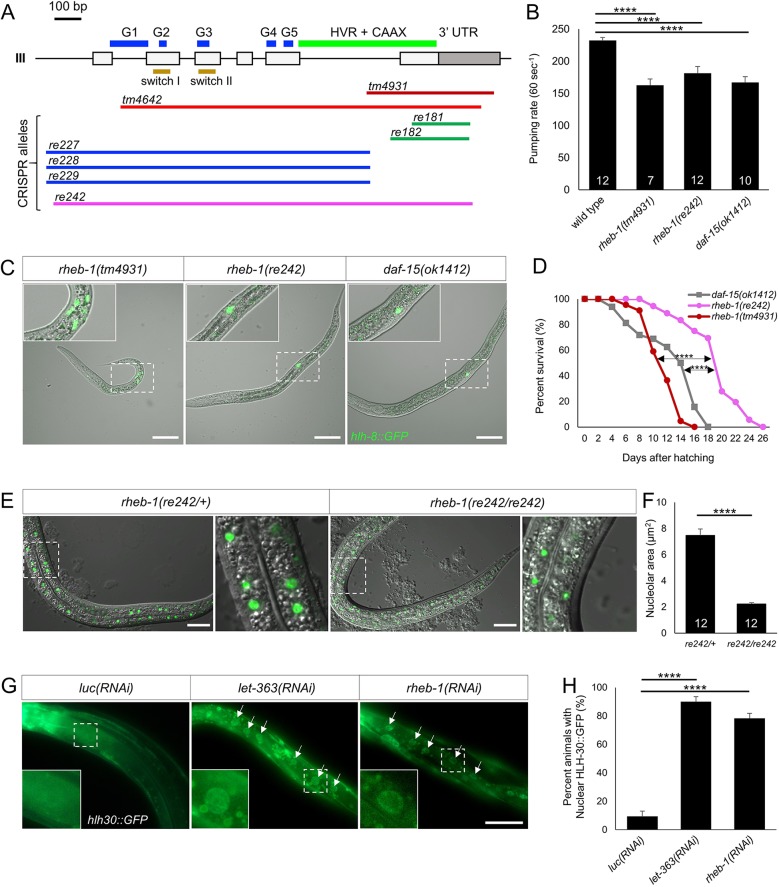
Deletion mutations in rheb-1 and daf-15 confer L3 arrest. (A) Exon/intron gene model of rheb-1 with location of sequences deleted by mutations indicated by lateral lines. Key structural elements of small GTPase proteins are indicated: G boxes (G1-5), switch I and II, and HVR+CAAX (hypervariable region+Cys-A-A-X prenylation target, where A=aliphatic and X=any residue; Wennerberg et al., 2005). (B) Decreased pharyngeal pumping rate of rheb-1 and daf-15 arrested mutant animals versus wild type. Y-axis indicates pumps per minute. Number in columns indicate number of animals scored. ****P<0.001 (ANOVA test). (C) Merged DIC plus GFP images of rheb-1(tm4931), rheb-1(re242) and daf-15(ok1412) arrested animals with M-lineage reporter ayIs6 [hlh-8::GFP]. daf-15(ok1412) and rheb-1(re242) animals arrested at L3 (indicated by sex myoblasts located at the A-P midline), whereas rheb-1(tm4931) animals arrested at L2 stage (indicated by undifferentiated M-lineage blast cells located posteriorly). Scale bars: 50 µm. (D) Kaplan–Meier curves show rheb-1(re242), rheb-1(tm4931) and daf-15(ok1412) arrested animals have mean lifespan at 19, 12 and 13 days post-hatching, respectively. P-values were calculated using the Kaplan–Meier estimator with the OASIS website for statistical analysis (Yang et al., 2011) (****P<0.001). (E) Merged DIC and GFP epifluorescent images of knuSi221[FIB-1::GFP], an intestinal marker of the nucleolus, in rheb-1(re242)/+ (left) versus rheb-1(re242)/rheb-1(re242) animals. Scale bars: 25 µm. (F) Quantification of FIB-1::GFP nucleolar volume in heterozygous versus homozygous mutants. P-value was calculated by t-test (****P<0.001). (G) Bacterially mediated RNAi depletion of let-363 or rheb-1 induced nuclear translocation of HLH-30::GFP. Arrows indicate intestinal nuclei. Scale bar: 50 µm. (H) Quantification HLH-30::GFP nuclear localization relative to control. P-value was calculated by Fisher's exact test (****P<0.001).

