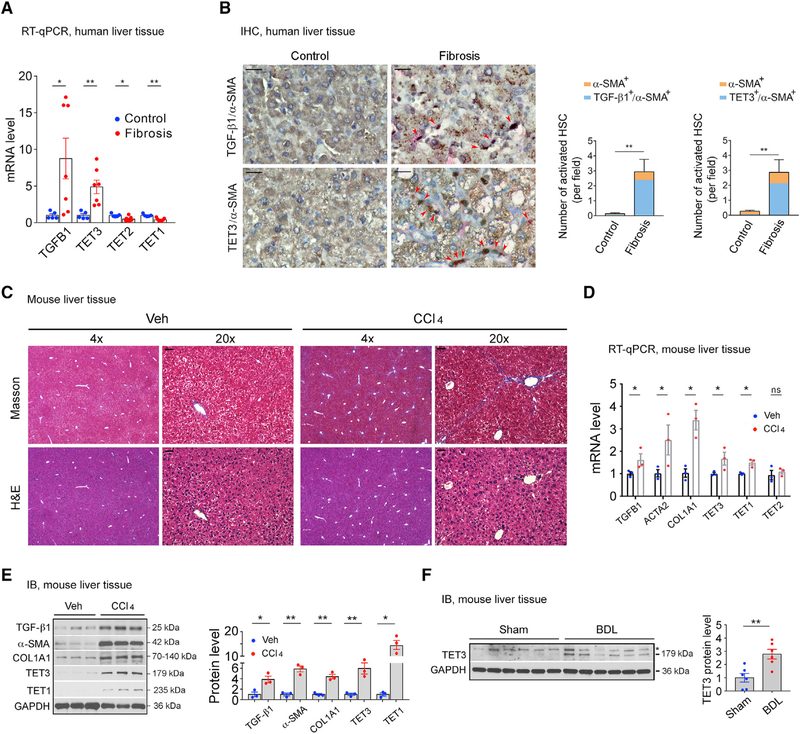
Figure 1. TET3 Upregulation in Fibrotic Livers.
(A) qPCR of TGFB1 and TETs from non-fibrotic and fibrotic human liver tissues. Each data point represents an individual patient, with five to seven patients per group.
(B) IHC of liver tissue sections from patients with non-fibrotic and fibrotic disease co-stained for α-SMA (pink) and TGF-β1 (brown) or α-SMA (pink) and TET3 (brown), with nuclei counterstained in blue. Red arrowheads mark activated HSCs. Three sections per patient sample were counted, with four patients per group. Fields were picked randomly, with counting done in a blinded manner. Magnification, 20×; scale bars, 100 μm. Numbers of activated HSCs (α-SMA+) co-expressing TGF-β1 (TGF-β1+/α-SMA+) or TET3 (TET3+/α-SMA+) per field are presented.
(C) Masson’s trichrome and H&E staining on liver sections from mice treated with vehicle or CCl4. Magnifications of 4× and 20× are presented. Scale bars, 100 μm.
(D) qPCR of indicated genes from liver tissues isolated from mice treated with vehicle or CCl4. Each data point represents an individual mouse, with three mice per group.
(E) Immunoblotting (IB) of indicated proteins from liver tissues isolated from mice treated with vehicle or CCl4. Each data point represents an individual mouse, with three mice per group.
(F) IB of TET3 from liver tissues isolated from mice sham operated or with BDL. Each data point represents an individual mouse, with six mice per group. The asterisk indicates nonspecific protein bands.
All data are representative of at least two independent experiments. Error bars are mean with SEM. *p < 0.05 and **p < 0.01; significance by Student’s t test.

