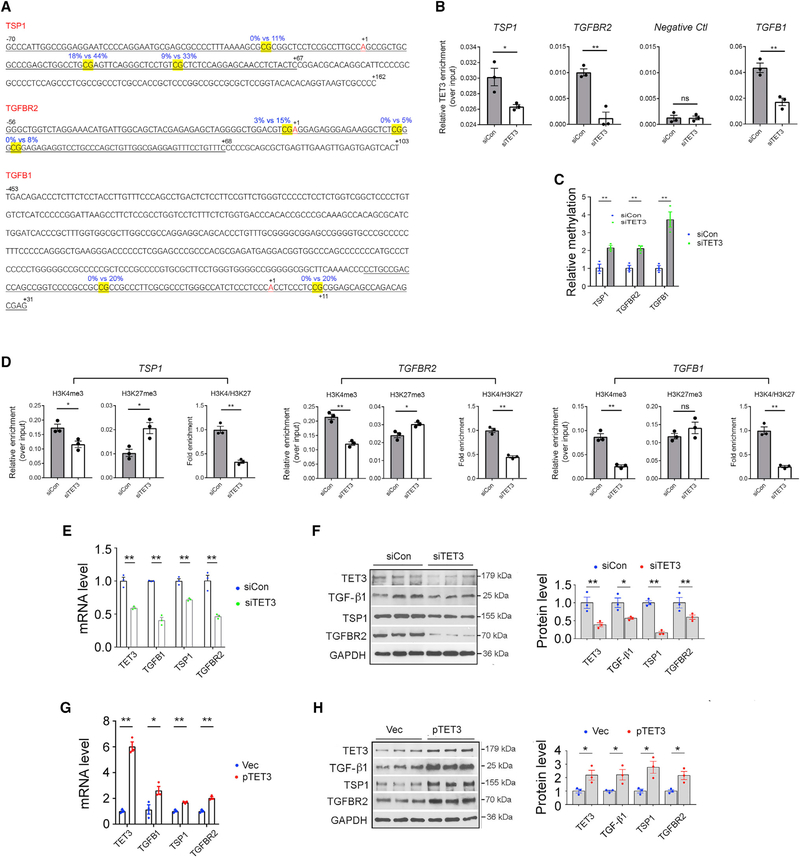
Figure 2. TET3-Dependent Epigenetic Regulation of TGF-β Pathway Genes.
(A) Sequences of CTRRs of TSP1, TGFBR2, and TGFB1. The differentially methylated CpGs are highlighted in yellow. Blue numbers mark percentage of methylation in siCon (left) or siTET3 (right) transfected leiomyoma cells as determined by genome-wide single-nucleotide-resolution methylation analysis. Black numbers indicate positions relative to the transcriptional start sites (+1). ChIP-qPCR amplified regions are underlined.
(B) LX-2 cells were transfected with siCon or siTET3, followed by ChIP-qPCR analysis at 48 h post-transfection. Data are presented as mean relative TET3 enrichment over input after normalization against preimmune IgG background signals.
(C) LX-2 cells were transfected with siCon or siTET3, followed by QMSP analysis 48 h later. Relative CTRR methylations of the indicated genes are shown.
(D) LX-2 cells were transfected with siCon or siTET3, followed by ChIP-qPCR analysis at 48 h post-transfection.
(E and F) qPCR (E) and IB (F) of indicated genes from LX-2 cells transfected with siCon or siTET3. RNA and protein were isolated at 48 h post-transfection.
(G and H) qPCR (G) and IB (H) of indicated genes from LX-2 cells transfected with empty vector (Vec) or a plasmid DNA expressing human TET3 (pTET3). RNA and protein were isolated at 48 h post-transfection.
All data are representative of three independent experiments. Error bars are mean with SEM of technical replicates (n = 3). *p < 0.05 and **p < 0.01; significance by Student’s t test.

