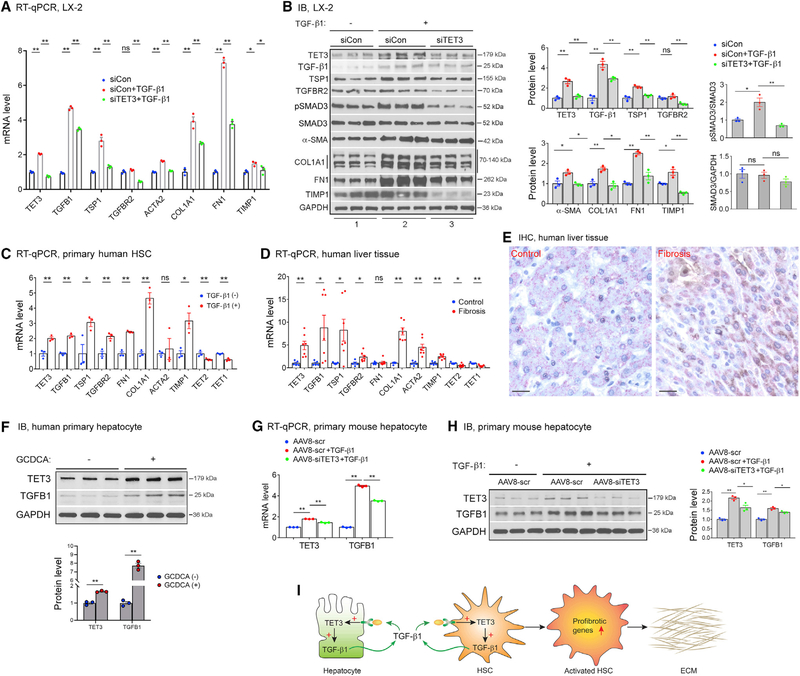
Figure 3. The TET3/TGF-β1 Positive Feedback Loop in HSCs and Hepatocytes.
(A and B) LX-2 cells were transfected with siCon or siTET3. 24 h later, cells were treated with TGF-β1 (5 ng/mL) (+) or vehicle (−), followed by RNA and protein extraction 24 h later. For pSmad3 and Smad3 analysis, protein was extracted 6 h after TGF-β1 stimulation. Expression of indicated genes was analyzed using qPCR (A) and IB (B). Error bars are mean with SEM of technical replicates (n = 3). *p < 0.05 and **p < 0.01; significance by one-way ANOVA with Tukey post-test.
(C) qPCR of indicated genes from primary human HSCs stimulated with TGF-β1 (2 ng/mL) (+) or vehicle (−) for 24 h. Each data point represents an individual patient, with three patients per group. Error bars are mean with SEM. *p < 0.05 and **p < 0.01; significance by Student’s t test.
(D) qPCR of indicated genes from non-fibrotic and fibrotic human liver tissues. Each data point represents an individual patient, with five to seven patients per group. Error bars are mean with SEM. *p < 0.05 and **p < 0.01; significance by Student’s t test.
(E) Representative IHC of liver tissue sections from patients (same patient groups as in Figure 1B) with non-fibrotic and fibrotic disease co-stained for HepPar1 (pink) and TET3 (brown), with nuclei counterstained in blue. Magnification, 400×; bars, 100 μm. Three sections per patient sample were analyzed, with four patients per group.
(F) IB of TET3 and TGF-β1 from human primary hepatocytes treated with vehicle (−) or GCDCA (+) at a final concentration of 100 μM for 48 h. Error bars are mean with SEM of technical replicates (n = 3). **p < 0.01; significance by Student’s t test.
(G and H) Primary mouse hepatocytes were infected with AAV8-scr or AAV8-siTET3 for 24 h, followed by treatment with TGF-β1 (5 ng/mL) (+) orvehicle (−). RNA
(G) and protein (H) were extracted 48 h later. Error bars are mean with SEM of technical replicates (n = 3). *p < 0.05 and **p < 0.01; significance by one-way ANOVA with Tukey post-test. All data are representative of at least two independent experiments.
(I) A positive feedback model in liver fibrosis. Stressed hepatocytes upregulate TET3 leading to increased production of TGF-β1 from hepatocytes. TGF-β1 acts on both hepatocytes and HSCs to stimulate more TGF-β1 production via the TET3/TGF-β1 positive feedback mechanism. In HSCs, TET3 also promotes profibrotic gene expression and subsequent ECM production via increasing expression of multiple TGF-β pathway genes.

