
Figure 2. NMN Treatment Restores Oocyte Quality, Follicle Dynamics, Embryo Development, and Live Birth Rates.
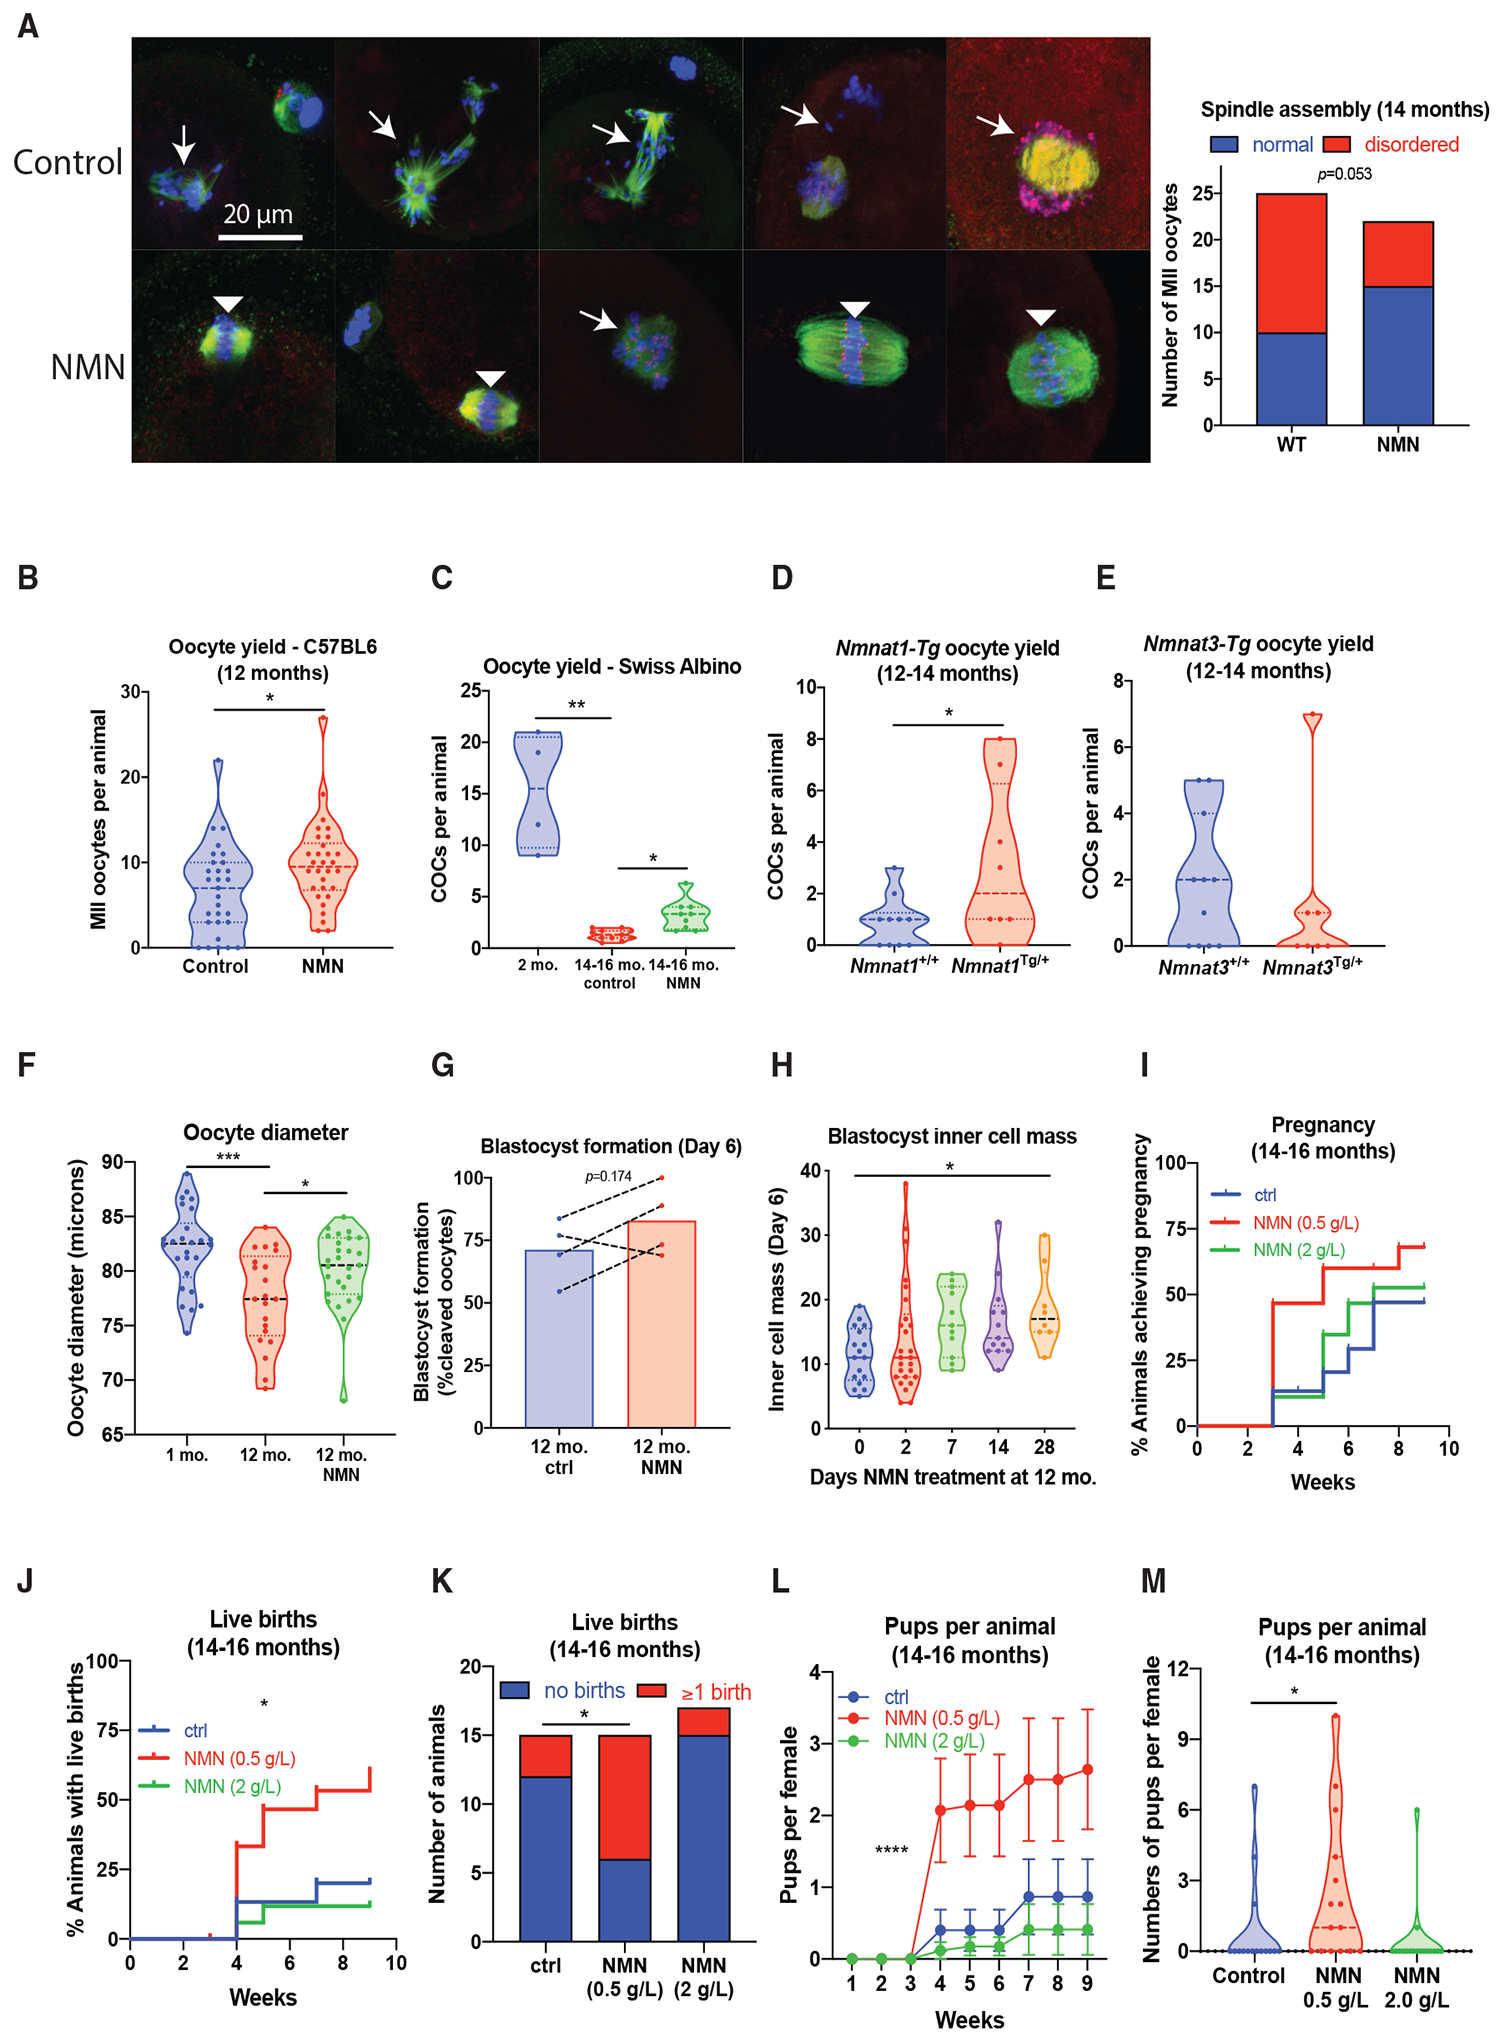
(A) NMN treatment (drinking water, 2 g/L, 4 weeks) with NMN from 14 months restores spindle assembly in immunostained oocytes (β-tubulin in green, Hoechst for DNA in blue, kinetochores in red, p = 0.0503 by Fisher’s exact test, n = 23–25 per group). Disordered spindles with lagging chromosomes are indicated by arrows, and normal, barrel-shaped bipolar spindles with DNA aligned along the metaphase plate are indicated by arrowheads.
(B and C) Oocyte yield following ovarian stimulation in (B) aged (12-month-old) C57BL/6JAusb mice (*p = 0.0211, two-tailed t-test, n = 29–30 animals per group) and (C) 14- to 16-month-old Swiss albino mice (Kruskal-Wallis 16.31, ***p = 0.0004, *p = 0.0295 by Dunnett’s mulitple comparison test, n = 4–11 per group).
(D and E) Aged (12- to 14-month-old) transgenic mice overexpressing NMNAT1 have increased oocyte yield (*p = 0.0416, two-tailed t-test, n = 8–10 per group) (D) in comparison to transgenics overexpressing NMNAT3 (n = 7–11) (E).
(F) Oocyte diameter following NMN treatment (2 g/L, drinking water, 4 weeks) in aged (12-month-old) or young (4- to 6-week-old) C57BL/6 females (F(2,71) = 8.504, ***p = 0.0002, *p = 0.0332 by Dunnett’s multiple comparison test, n = 21–27 oocytes per group).
(G) In a parallel cohort, oocytes were used for IVF, with blastocyst formation at day 6 of embryo development (each datapoint is cumulative data from one independent experiment).
(H) 12-month-old C57BL/6 females were treated for the indicated times with NMN in drinking water (2 g/L), and MII oocytes were subjected to IVF. At day 6, inner cell mass was assessed (Kruskal-Wallis 11.93, *p = 0.0337 by Dunn’s multiple comparison test, n = 8–26 oocytes per group). Previously untreated 13-month-old C57BL/6 females (n = 15–17 per group) were treated for 4 weeks with NMN in drinking water at two doses (0.5 and 2 g/L), following which a male was introduced and breeding performance was assessed over the next 9 weeks.
(I–M) Breeding performance was assessed by (I) cumulative time to pregnancy, (J) cumulative time to live birth (log-rank test, **p = 0.0059), (K) overall proportion achieving live birth (Fisher’s exact test, *p = 0.0253 ctrl versus 0.5 g/L NMN), (L) cumulative number of pups born over time (repeated-measures ANOVA, NMN F(2, 43) = 4.925, p = 0.0119, Dunnett’s multiple comparison ctrl versus NMN 0.5, ****p < 0.0001, error bars show SEM), and (M) overall number of pups per female (Kruskal-Wallis 9.220, p = 0.0100, Dunn’s multiple comparison, *p = 0.0491 ctrl versus 0.5 g/L NMN).