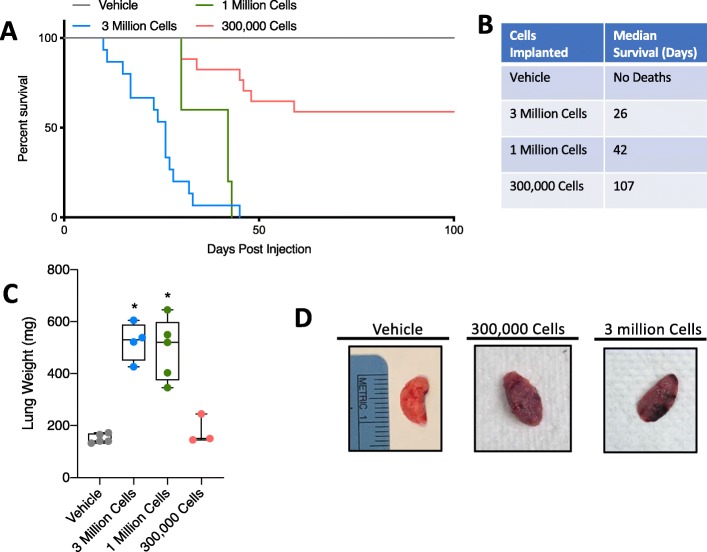
Fig. 5.
Tumor cell number titration modulates survival time. a Survival curve for mice injected with vehicle or a range of tumor cells (300,000, 1 million, or 3 million). b Table depicting the median survival for each group. c Total lung weight (all lobes) in milligrams for each group. Individual points represent individual animals. Boxes represent the inner quartile, and whiskers represent the minimum and maximum values. *p < 0.05 Student’s t test. n = 5, vehicle; 4, 3 million; 5, 1 million; 3, 300,000 7-week-old male 129S2/SvPasCrl mice. d Representative images of lungs from vehicle, 300,000 cell and 3 million cell groups. Ruler reference is in centimeters

