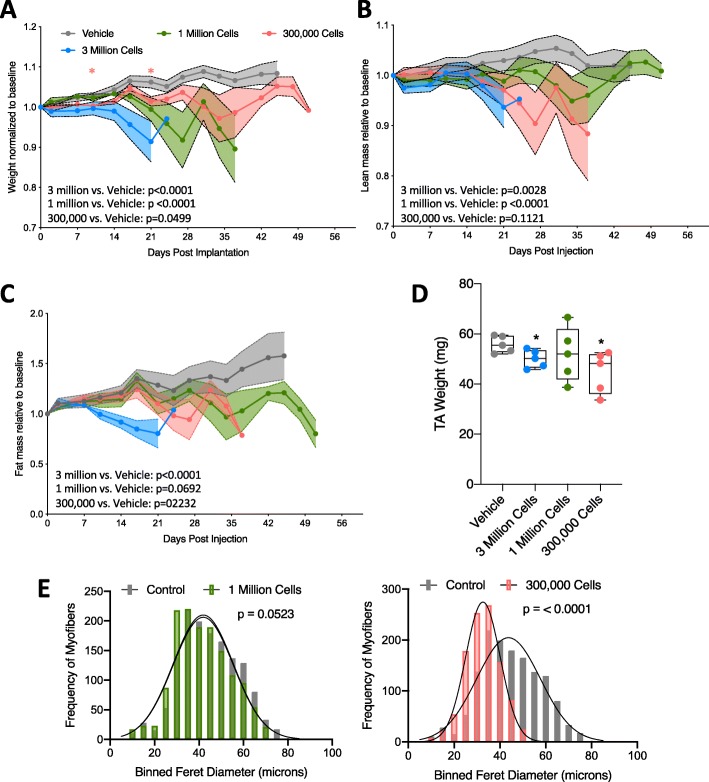
Fig. 6.
Tumor-bearing mice exhibit progressive tissue loss regardless of initial transplanted cell number. a Total mouse weight across study, normalized to pre-tumor baseline weight. Error bars are SEM, and statistical analysis is as described in Fig. 1f. b echoMRI calculated total fat mass across study, normalized to pre-tumor baseline fat mass. Error bars are SEM, and statistical analysis is as described in Fig. 1f. c echoMRI calculated total lean mass across study, normalized to pre-tumor baseline lean mass. Error bars are SEM, and statistical analysis is as described in Fig. 1f. d TA weight in milligrams for each group in study. Individual points represent individual animals. Boxes represent the inner quartile, and whiskers represent the minimum and maximum values. e Quantification of minimum feret diameters from muscles of tumor-bearing (1 million cells or 300,000 cells) and vehicle-treated mice. Feret diameters were binned to a histogram and fit with a non-linear regression (Gaussian, least squares regression). Myofibers from tumor-bearing mice were smaller, p values calculated by extra sum-of-squares F test. One million vs. vehicle (left, p = 0.0523), 300,000 vs. vehicle (right, p < 0.0001). n = 5, vehicle; 4, 3 million; 5, 1 million; 3, 300,000 7-week-old male 129S2/SvPasCrl mice

