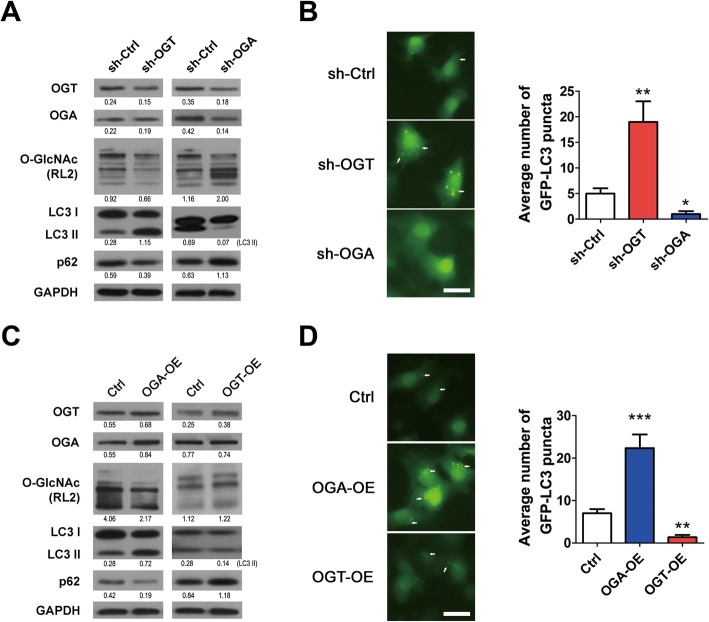
Fig. 2.
Manipulations of OGT or OGA alter autophagic flux. a – Expressions of OGT, OGA, O-GlcNAc (RL2), LC3 I, LC3 II and p62 in 5637-GFP-LC3 cells with OGT or OGA knockdown were determined using western blotting. b – GFP-LC3 fluorescence was captured with fluorescence microscopy in the stable cells described in (a). c – The expression levels of OGT, OGA, O-GlcNAc (RL2), LC3 I, LC3 II and p62 in 5637-GFP-LC3 cells with OGT or OGA overexpression (OE) were determined using western blotting. d – GFP-LC3 fluorescence for the cells described in (c) was captured with fluorescence microscopy. The average number of GFP-LC3 puncta was calculated for 200 cells. Data in the histograms are shown as the means ± SD. Scale bar: 20 μm. *p < 0.05, **p < 0.01, ***p < 0.001

