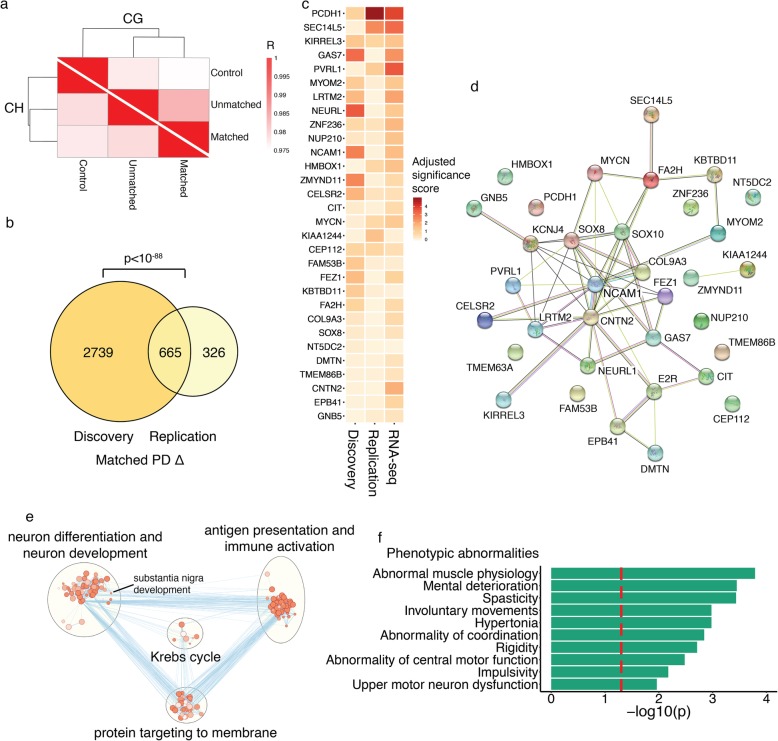
Fig. 3.
Independent validation that epigenetic dysregulation is greater in the symptom-dominant PD hemisphere. DNA methylation at enhancers and promoters was examined in an independent cohort of PD patients and controls. Prefrontal cortex neurons from both hemispheres were examined (n = 31 controls, 26 PD patients). a Divergence of epigenetic profiles in neurons of PD hemispheres matched or unmatched to the side of symptom dominance from those of control neurons. Shown are Pearson correlations comparing DNA methylation status of control, matched, and unmatched groups. Darker red signifies a higher DNA methylation similarity between diagnosis groups. b Concordance between discovery and replication cohorts. Venn diagram showing overlap of discovery and replication cohorts for genes with greater epigenetic abnormalities in the symptom-dominant hemisphere of PD patients. The p value represents the significance of the discovery and replication cohort overlap, by hypergeometric test. c Top 30 genes most associated with PD symptom lateralization. Genes were ranked across datasets to determine the most robustly dysregulated genes in the symptom-dominant hemisphere of PD patients. The discovery and replication DNA methylation data, as well as the RNA-seq data, was used. Genes are listed in ranked order, and the heatmap depicts the adjusted significance score in each dataset. d Network analysis of top 30 genes involved in symptomatic asymmetry in PD centers on NCAM1. Network analysis performed by STRING. e Pathways of proteomic alterations involved in hemispheric asymmetry and symptom lateralization in PD. Protein changes were determined by mass spectrometry in the prefrontal cortex of PD patients, relative to controls, and between the PD symptom-dominant and non-dominant hemispheres (n = 3–5 individuals). Pathway enrichment analysis performed by g:Profiler (nodes are q < 0.05 pathways, hypergeometric test) and pathways were merged in Enrichment Map. f Top disease pathways of proteins involved in hemispheric asymmetry in PD. Pathway analysis was done by g:Profiler. Threshold for significance (red dashed line) is q < 0.05

