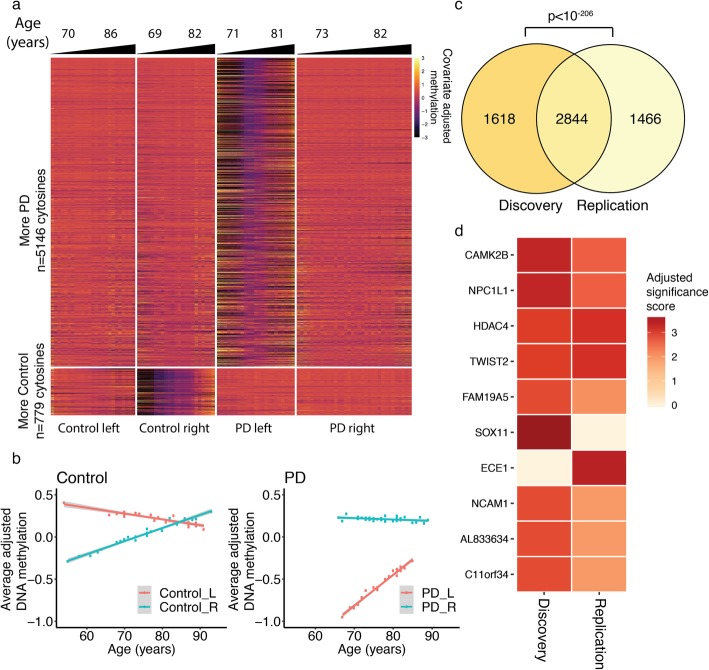
Fig. 4.
Progressive loss of hemispheric asymmetry in DNA methylation with aging. Age-dependent changes in DNA methylation in neurons of the left and right hemisphere of PD patients and controls (n = 23 PD-left, 34 PD-right, 25 control-left, 23 control-right). a Heatmap showing adjusted DNA methylation levels at the 5925 cytosine sites exhibiting significant changes in hemispheric asymmetry with aging (q < 0.05, robust linear model followed by contrasts; DNA methylation adjusted for sex, postmortem interval and neuronal subtype proportion). Cytosine sites with more aging changes in hemispheric asymmetry in PD (upper panels) or in controls (lower panels) are shown. The first and third quartiles of age for each group are shown. b Scatter plot of aging changes in DNA methylation across hemispheres of controls and PD patients. Averaged adjusted DNA methylation values is shown for the sites significantly associated with aging (DNA methylation adjusted for sex, postmortem interval and neuronal subtype proportion). Data for the left (red) and right (blue) hemisphere is shown for controls (left panel) and PD patients (right panel). The gray area represents confidence intervals. c Concordance in aging changes in DNA methylation in the discovery and replication cohort. Venn diagram showing the significance of overlap between the discovery and replication cohorts in the genes with age-dependent changes in hemispheric asymmetry in DNA methylation. The p value represents significance of overlap by hypergeometric test. d Top 10 genes involved in aging changes in hemispheric asymmetry. Genes affected by aging changes in DNA methylation were ranked using the discovery and replication DNA methylation datasets. Genes are listed by ranked order, and the heatmap shows adjusted rank significance score in each dataset

