Fig. 1.
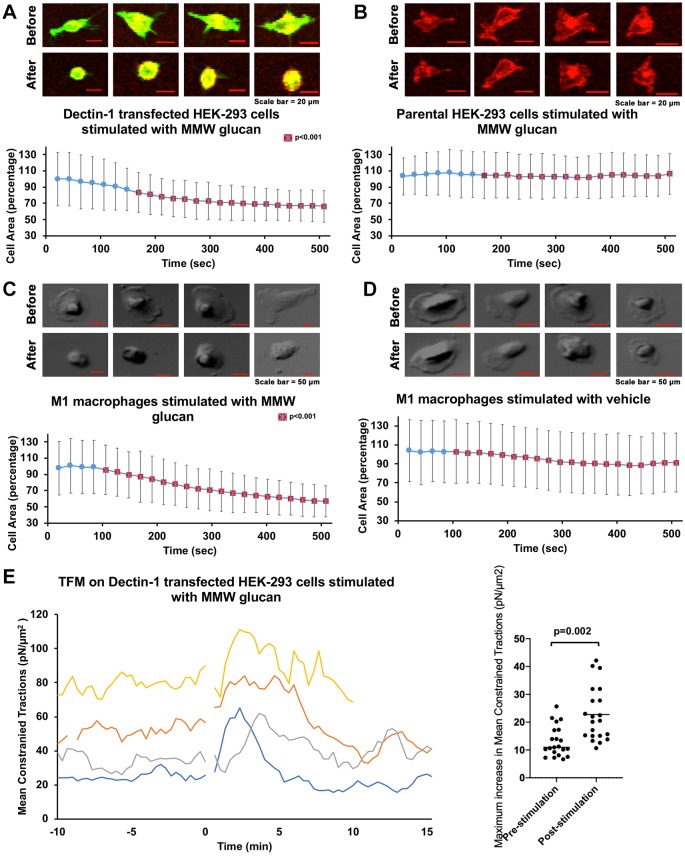
Dectin-1-mediated glucan-dependent cellular contraction. (A) HEK-293 cells transfected with Emerald–Dectin-1 (green) and stained with Cell Mask Deep Red (CMDR). Images labeled ‘Before’ are pre-stimulation cells and those labeled ‘After’ are 500 s after stimulation with MMW glucan. Scale bars: 20 µm. The area at each time point was normalized to the average cell area of Dectin-1 transfected HEK-293 cells observed prior to glucan stimulation and given as a percentage. MMW glucan was added at time 0. n=29 total cells pooled from ≥3 independent experimental replicates. (B) Control HEK-293 cells stained with CMDR, pre-stimulation and 500 s after stimulation with MMW glucan. Data were normalized as in A. Scale bars: 20 µm. n=31 total cells pooled from ≥3 independent experimental replicates. (C) DIC images of M1 macrophages before and after stimulation with MMW glucan. Scale bars: 50 µm. n=31 total cells pooled from ≥3 independent experimental replicates. Data were normalized as in A. (D) DIC images of mock-stimulated M1 macrophages. Scale bar: 50 µm. n=28 total cells pooled from ≥3 independent experimental replicates. Data were normalized as in A. Data in A–D represent sample mean±s.d. Red squares with a cross indicate significant difference (P<0.01) in cell area at a time point between the Dectin-1-transfected cells and control cells in B, or M1 microphages (in C) compared with control macrophages (in D). (E) Mean constrained tractions from four independent HEK-293 cells transfected with Emerald–Dectin-1 illustrating increased traction force after stimulation with MMW glucan. Dot plot indicates the mean maximum increase in mean constrained tractions of individual cells with standard deviation, pre- and post-stimulation with glucan (n=20 independent cells).

