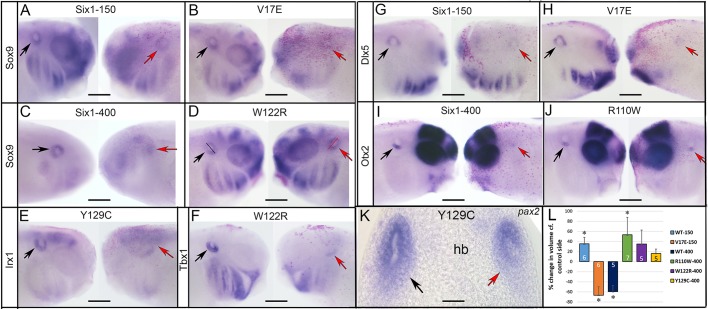
Fig. 5.
Examples of changes in otic vesicle gene expression. (A) Six1WT-150 reduced the otic expression of sox9 (red arrow) compared to the control side (black arrow) of same embryo. (B) V17E had a similar effect. (C) Six1WT-400 reduced sox9 otic expression. (D) W122R caused slightly darker otic expression of sox9 and what appeared to be a slightly larger otic vesicle (red bar) compared to the control side (black bar). (E) Y129C reduced irx1 otic expression. (F) W122R reduced tbx1 otic expression. (G) Six1WT-150 reduced dlx5 otic expression. (H) V17E also reduced dlx5 otic expression. (I) Six1WT-400 reduced the ventral otic expression of otx2. (J) R110W did the same. See Fig. 4 for frequencies. (K) Some larvae were sectioned to measure otic vesicle volume. In the shown Y129C larva, pax2 expression was reduced in the otic vesicle on the injected side (red arrow) compared to the control side (black arrow). hb, hind brain. (L) The otic vesicle volumes of SixWT, mutant Six1 and the control side of the same larva were calculated (Table S1). Because larvae were different sizes, mean experimental volumes were plotted as percentage change compared to mean control volumes (±s.e.m.) (two-tailed Student's t-test, *P<0.05). Six1WT-150 and R110W caused a significant increase in otic vesicle volume compared to the control side of the same embryo, whereas V17E and Six1WT-400 caused a significant decrease. Experiments were replicated three times and the number of tadpoles analyzed noted within each bar. Scale bars: 300 μm (A-J), 50 μm (K).

