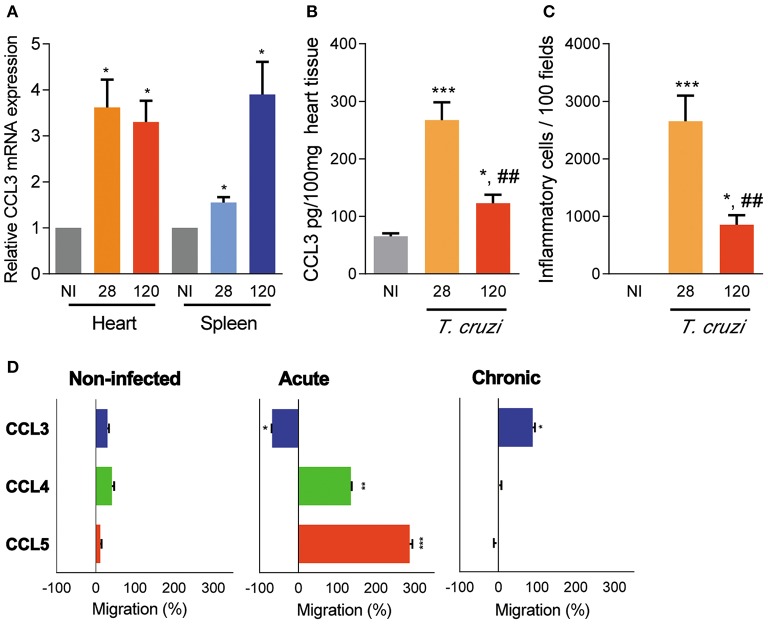
Figure 1.
CCL3 expression in the heart and spleen tissues and CC-chemokine-induced chemotaxis of circulating cells of T. cruzi-infected C57BL/6 mice. Mice were infected with 100 trypomastigote forms of the Colombian T. cruzi strain and analyzed during the acute (28 dpi) and chronic (120 dpi) phases. (A) The hearts were collected; mRNA expression was determined by RT-PCR with primers specific for the CCL3 and standardized against HPRT, at 28 and 120 dpi. Data are shown as relative CCL3 mRNA expression. (B) Extracts of heart tissues were prepared and CCL3 concentrations estimated by ELISA. Data are expressed as ng of CCL3 per 100 mg of heart tissue. (C) Hearts were collected and analyzed by IHC for CD4+, CD8+, and F4/80+ cells. The numbers of total inflammatory cells in 100 microscopic fields are shown. (D) Ex vivo migration of peripheral blood mononuclear cells in the presence of the CC-chemokines CCL3, CCL4 and CCL5, at 28 and 120 dpi. The migration assay was performed using three mice per group. Data are shown as percentage of migration (%) induced by CC-chemokines compared to migration in absence of stimulus. The assay was performed in triplicate for each point and for each mouse sample. Each experimental group consisted of three mice non-infected (NI) mice and five to seven T. cruzi-infected ccl3+/+ mice in two independent experiments. The data are represented as means ± SE. *p < 0.05, **p < 0.01, and ***p < 0.001, comparing T. cruzi-infected and NI mice; ##p < 0.01, comparing T. cruzi-infected mice at 28 and 120 dpi (ANOVA Bonferroni posttest).

