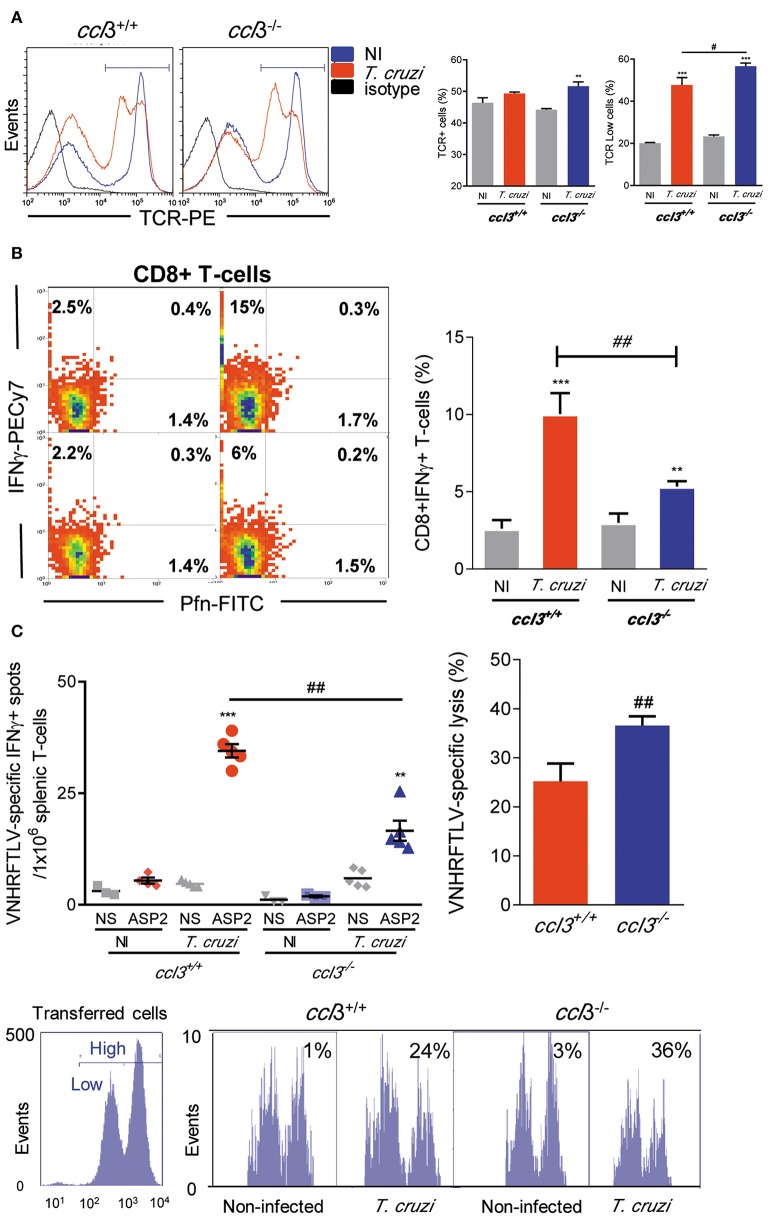
Figure 4.
Cell phenotype and effector inflammatory/cytotoxic functions of splenic CD8+ T-cells. ccl3+/+ and ccl3−/− mice were infected with 100 trypomastigote forms of the Colombian T. cruzi strain and analyzed at 120 dpi. (A) TCR expression in splenocytes. After selection of singlets (FSC-Lin × FSC-Area, R1), dead-cell exclusion (FSC-A × SSC-Lin, R2), TCR histograms (representative figures), graphs show total TCR+ cells (%) and TCRLow cells (%). (B) Presence of Pfn+ and IFNγ+ CD8+ T-cells. After selection of singlets (FSC-Lin × FSC-Area, R1), dead-cell exclusion (FSC-A × SSC-Lin, R2), TCR × CD8 dot plot (gating on TCR+CD8+ cells, R3), representative Pfn × IFNγ dot plots are shown. Graph shows CD8+ IFNγ+ T-cells (%). (C) The numbers of CD8+ IFNγ+ were determined by ex vivo ELISpot stimulating splenocytes with the H-2Kb-resctricted ASP2 VNHRFTLV peptide. Bars represent the in vivo specific cytotoxicity lysis detected in T. cruzi-infected ccl3+/+ and ccl3−/− mice. Each experimental group consisted of three NI mice and four to five T. cruzi-infected mice. Representative histogram profiles of in vivo cytotoxicity assay showing the specific lysis of in NI controls and T. cruzi-infected ccl3+/+ mice of H-2Kb-resctricted VNHRFTLV peptide-labeled CFSEhigh cells compared with non-stimulated CFSElow cells, at 120 dpi. Experiments were repeated twice. Data are presented as means ± SE. **p < 0.01 and ***p < 0.001, comparing T. cruzi-infected and NI mice; #p < 0.05 and ##p < 0.01, comparing T. cruzi-infected ccl3+/+ and ccl3−/− mice. (ANOVA Bonferroni posttest, t-Student test).

