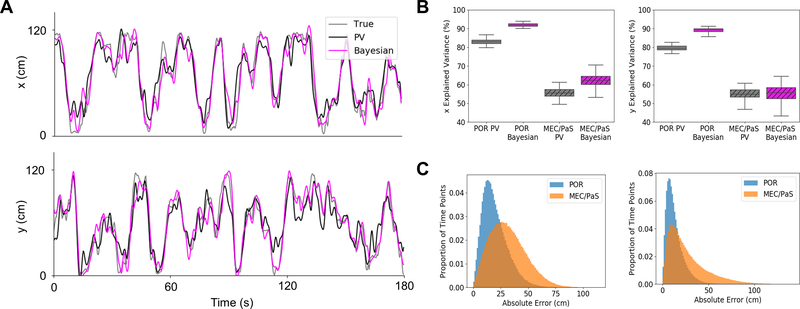
Fig. 2. Coding for allocentric location by cells in POR.
(A) Results from an example decoding iteration showing fit of two decoding algorithms (population vector (PV) and 2-step Bayesian) to the real x- and y-positions of an animal over a 3 min period. (B) Box plots showing variance in the x- and y-positions of the animal explained by each decoder based on cells drawn from each region (POR and MEC/PaS). Center line indicates median, box limits indicate upper and lower quartiles, and whiskers indicate 1.5x interquartile range. (C) Histograms showing counts of absolute error in decoded location across all iterations of each decoder (left: population vector, right: Bayesian) for cells drawn from POR and MEC/PaS.

