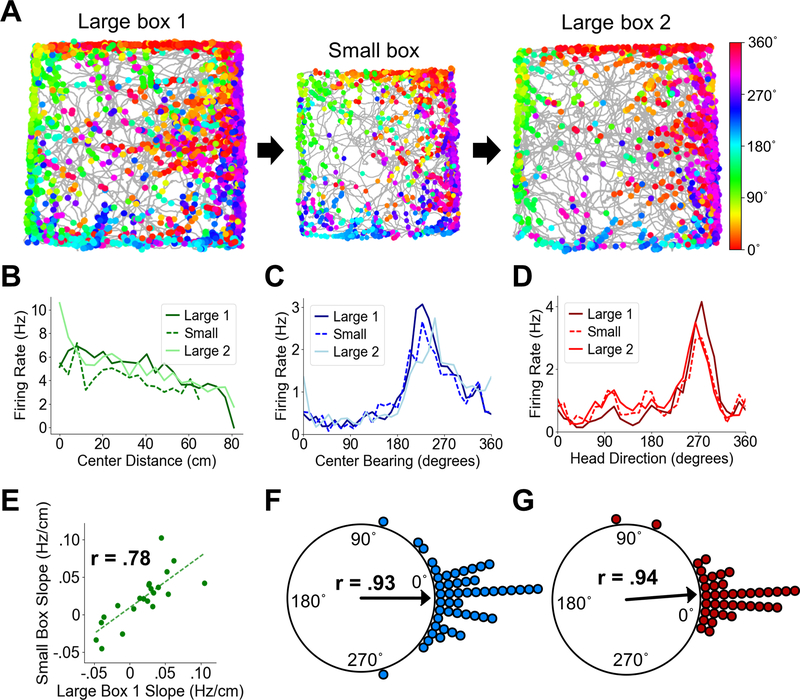
Fig. 4. POR center-distance cells encode absolute distances.
(A) Directional spike plots for an example center-bearing by center-distance cell showing tuning stability across the large box – small box – large box cycle. Color bar indicates head direction. (B) Center-distance tuning curves for an example distance-tuned cell showing highly similar tuning slopes across sessions. (C) Center bearing tuning curves for an example center-bearing cell showing stability across sessions. (D) Head direction tuning curves for an example HD cell showing stability across sessions. The curves in C and D are taken from one conjunctively tuned cell. (E) Scatter plot showing firing rate slopes for center-distance tuning curves between Large 1 and Small sessions for all recorded POR center-distance cells. (F) Polar plot showing shift in preferred center bearing between Large 1 and Small sessions for all recorded POR center-bearing cells (each dot represents one cell). (G) Polar plot showing shift in preferred firing direction between Large 1 and Small sessions for all recorded POR HD cells (each dot represents one cell).

